 English
 Nederlands
What’s new in the Energy Transition Model?
Upcoming changes
- November: new production technologies will be added for the production of transport fuels and feedstock for the chemical industry, such as Fischer-Tropsch and pyrolysis. In addition, the use of transport fuels and feedstock for the chemical industry will be expanded for existing and newly added carriers (such as biomethanol and bionaphtha).
- November: PyETM will be formally released. It is a Python package to interact with the API of the ETM in a standardized way.
October 2025
New start year 2023 for the Netherlands
Replacing 2019 as the start year, 2023 is now set as the default for new scenarios for the Netherlands and all its regions: municipalities, provinces and RES regions.
This start year update also includes improvements in data quality, among others:
- Updated values for final demand and energy production across all sectors, based on recognized data sources such as Eurostat, CBS, Klimaatmonitor and Emissieregistratie.
- Enhancements in data on heat demand in the built environment, such as insulation values and useful heat demand, by using more up-to-date and higher-quality sources.
- Significant improvements in hourly supply and profiles, aligning with recognized data sources such as the Pan-European Climate Database (PECD).
- Overall improvements in data transparency and documentation, see the Dataset Manager for the regional datasets and ETDataset for the national dataset.
Bug fixes
- After the addition of naphtha in the August release, the energetic CO2 emissions of the industry sector were wrongly included non-energetic emissions for naphtha, leading to an overestimation of this sector’s CO2 emissions. The original emissions are now restored by excluding non-energetic naphtha.
- For steel-producing European countries (excluding the Netherlands), the transformation input of cokes in blast furnaces was counted twice in the start year data. This issue has been fixed. The flows of the Eurostat energy balance, see the Dataset Manager, are now more accurately represented in the ETM.
- In some charts, the hourly electricity demand of cooling in buildings did not cover all cooling technologies. This has been fixed.
Technical changelog
- Changelog of the area codes related to the update of Dutch datasets: 202510_changelog_area_code.csv
September 2025
New features
- Several sliders in the Biomass section have been moved to more intuitive locations in the model. Specifically:
- The use of wood pellets in cyclone ovens for steel production can now be set in the Steel section.
- The sliders that set the oil mix per demand sector have been moved to their respective demand sectors: Industry, Agriculture, Households and Buildings. Note: for some regions it is not possible to set the oil mix for all demand sectors.
Bug fixes
- The costs and revenue of respectively imported and exported electricity were calculated incorrectly. This has now been fixed, which causes the net costs of electricity exchange with neighbouring countries to change for existing scenarios.
- The data export of annual costs was not working due to an issue. This has been fixed.
- Due to an issue in the modifiable profiles, uploading a custom profile for weather-related profiles (such as solar PV and wind) gave an error. This issue has been solved: the weather-related profiles can now be uploaded again without any errors.
August 2025
New features
- Naphtha is now explicitly modelled in the ETM. Previously, naphtha was included in the aggregated carrier oil products as a product from refineries. Changes include:
- Naphtha can be produced by refineries or imported in case of shortages.
- Assumptions can be made for the final demand of naphtha in the chemical industry as an energetic fuel or as (non-energetic) feedstock.
- Datasets are updated to include the production and final demand of naphtha in the start year. See the Dataset Manager for data for a specific region.
- Results in existing scenarios might change slightly as a consequence of splitting off naphtha from oil products.
- Existing scenarios created for Germany and Denmark with start year 2015 are now updated to 2019. This may have affected outcomes for those scenarios.
Bug fixes
- Modifiable profiles of type ‘Capacity profile’ (such as solar PV and wind profiles) are now downloaded in the same format as they should be uploaded. Previously, a normalised profile was obtained when downloaded, which required a conversion step to transform the profile to the required format in which it needed to be uploaded. This is not needed anymore. Read more about modifiable profiles in the documentation.
- For a few Dutch provincial and RES datasets, a minor correction was made in the rounding values in the start year data. The fix might have resulted in very slight changes (if any) in households heat demand in existing scenarios.
Technical changelog
July 2025
New features
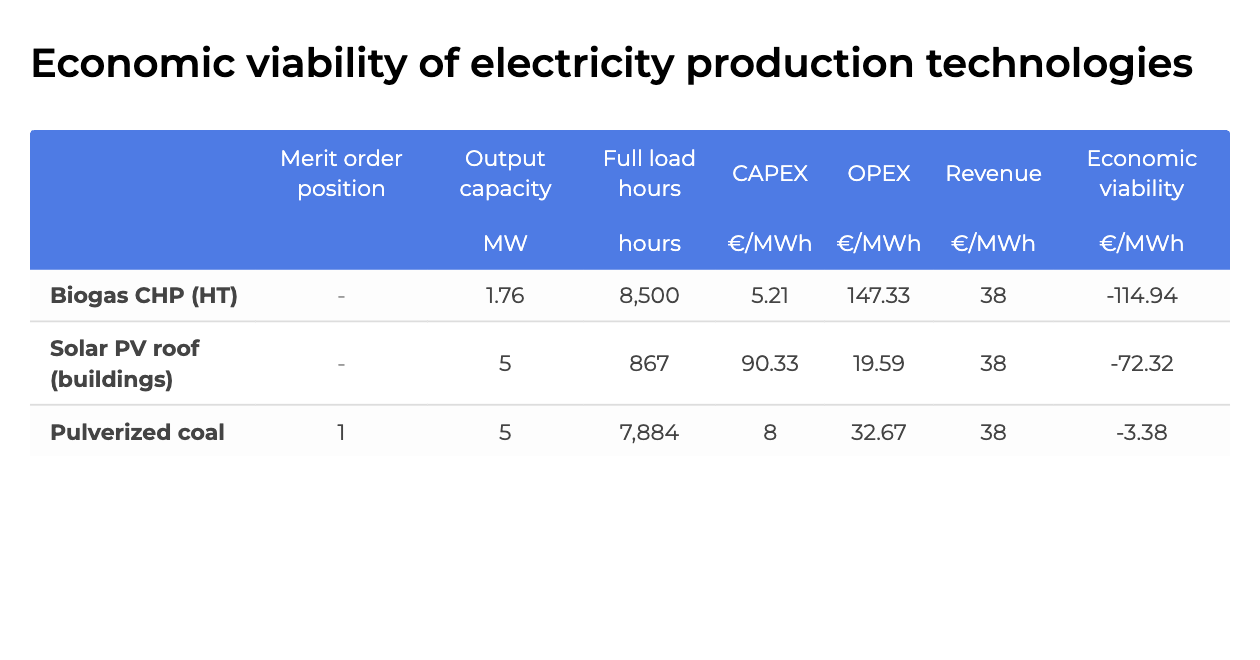
New tables available to explore economic viability
The ETM now includes three new economic viability tables that provide comprehensive cost-benefit analyses for electricity production, storage, and flexible demand technologies. The tables enable users to gain a first insight in the cost effectiveness of these assets. The tables can be found in the “Cost” section of the charts selection. See the documentation for more information.
Other new features
- With the next Deploy in August, all existing scenarios for Germany and Denmark with start year 2015 will automatically be updated to start year 2019.
Bug fixes
- The power shortage dashboard item showed an incorrect number for scenarios with household batteries, this also caused minor errors in the electricity price calculations. This issue is now fixed.
- Users who are not logged in can now download the profiles uploaded in public scenarios.
- A number of fixes to the password reset process and user emails have been made, this makes the process to reset the user passwords more user-friendly
June 2025
New features
- The new table Power shortage is now available, which provides detailed insights into the volume, peak capacity and duration of power shortages in a scenario. Find this table via the charts and tables overview or via the Power shortage dashboard item (read more about dashboard items here).
- Improvements have been made in the Households sector concerning the available sliders. This includes:
- The efficiency improvement of appliances can now be set using a single functional slider, instead of separate sliders per appliance. For existing scenarios where the old sliders were set, the average efficiency improvement is transferred to the new slider.
- The sliders that set behaviour changes were outdated and are removed from the model.
- Consult the technical changelog below for more details on changes in sliders (inputs).
- It is now possible to upload different custom profiles for deep and shallow geothermal technologies. Before, it was only possible to upload one custom profile that was applied to both deep and shallow geothermal technologies.
Bug fixes
- There was a bug in the custom profiles for hydro power, solar thermal and geothermal heat, which caused uploaded profiles for these technologies to not be processed correctly and prevented the related full load hours from being set. This issue has now been resolved, wich means that the custom profiles and related full load hours are now processed and set correctly.
- For various Dutch municipal datasets, the final demand of heat in Households in the start year was incorrect. This has been corrected.
Technical changelog
May 2025
New features
- Several improvements have been made to increase the speed of model calculations, contributing to a better overall user experience.
- Improvements in start year data of the Antwerp dataset have been made, related to transport and heating in the built environment. Consult the Dataset Manager to view this dataset.
Bug fixes
- Although issues are continuously being solved, this month does not have any bug fixes relevant to mention here.
Technical changelog
- No relevant changes to inputs have been made.
April 2025
New features
Stable version release #2025-01
The first stable version of the ETM is released, marking a major milestone for the model. Traditionally, the ETM has been under continuous development to capture the latest energy system modelling features, bug fixes and updates to datasets. The downside of this was that scenario settings, outcomes and dataset values could change over time. With the the stable version release, users now have the choice to work on the traditional and default version, #latest, or on the new and stable version, #2025-01.
The overview below shows the differences between #latest and #2025-01 and shows how to switch environments in the model.
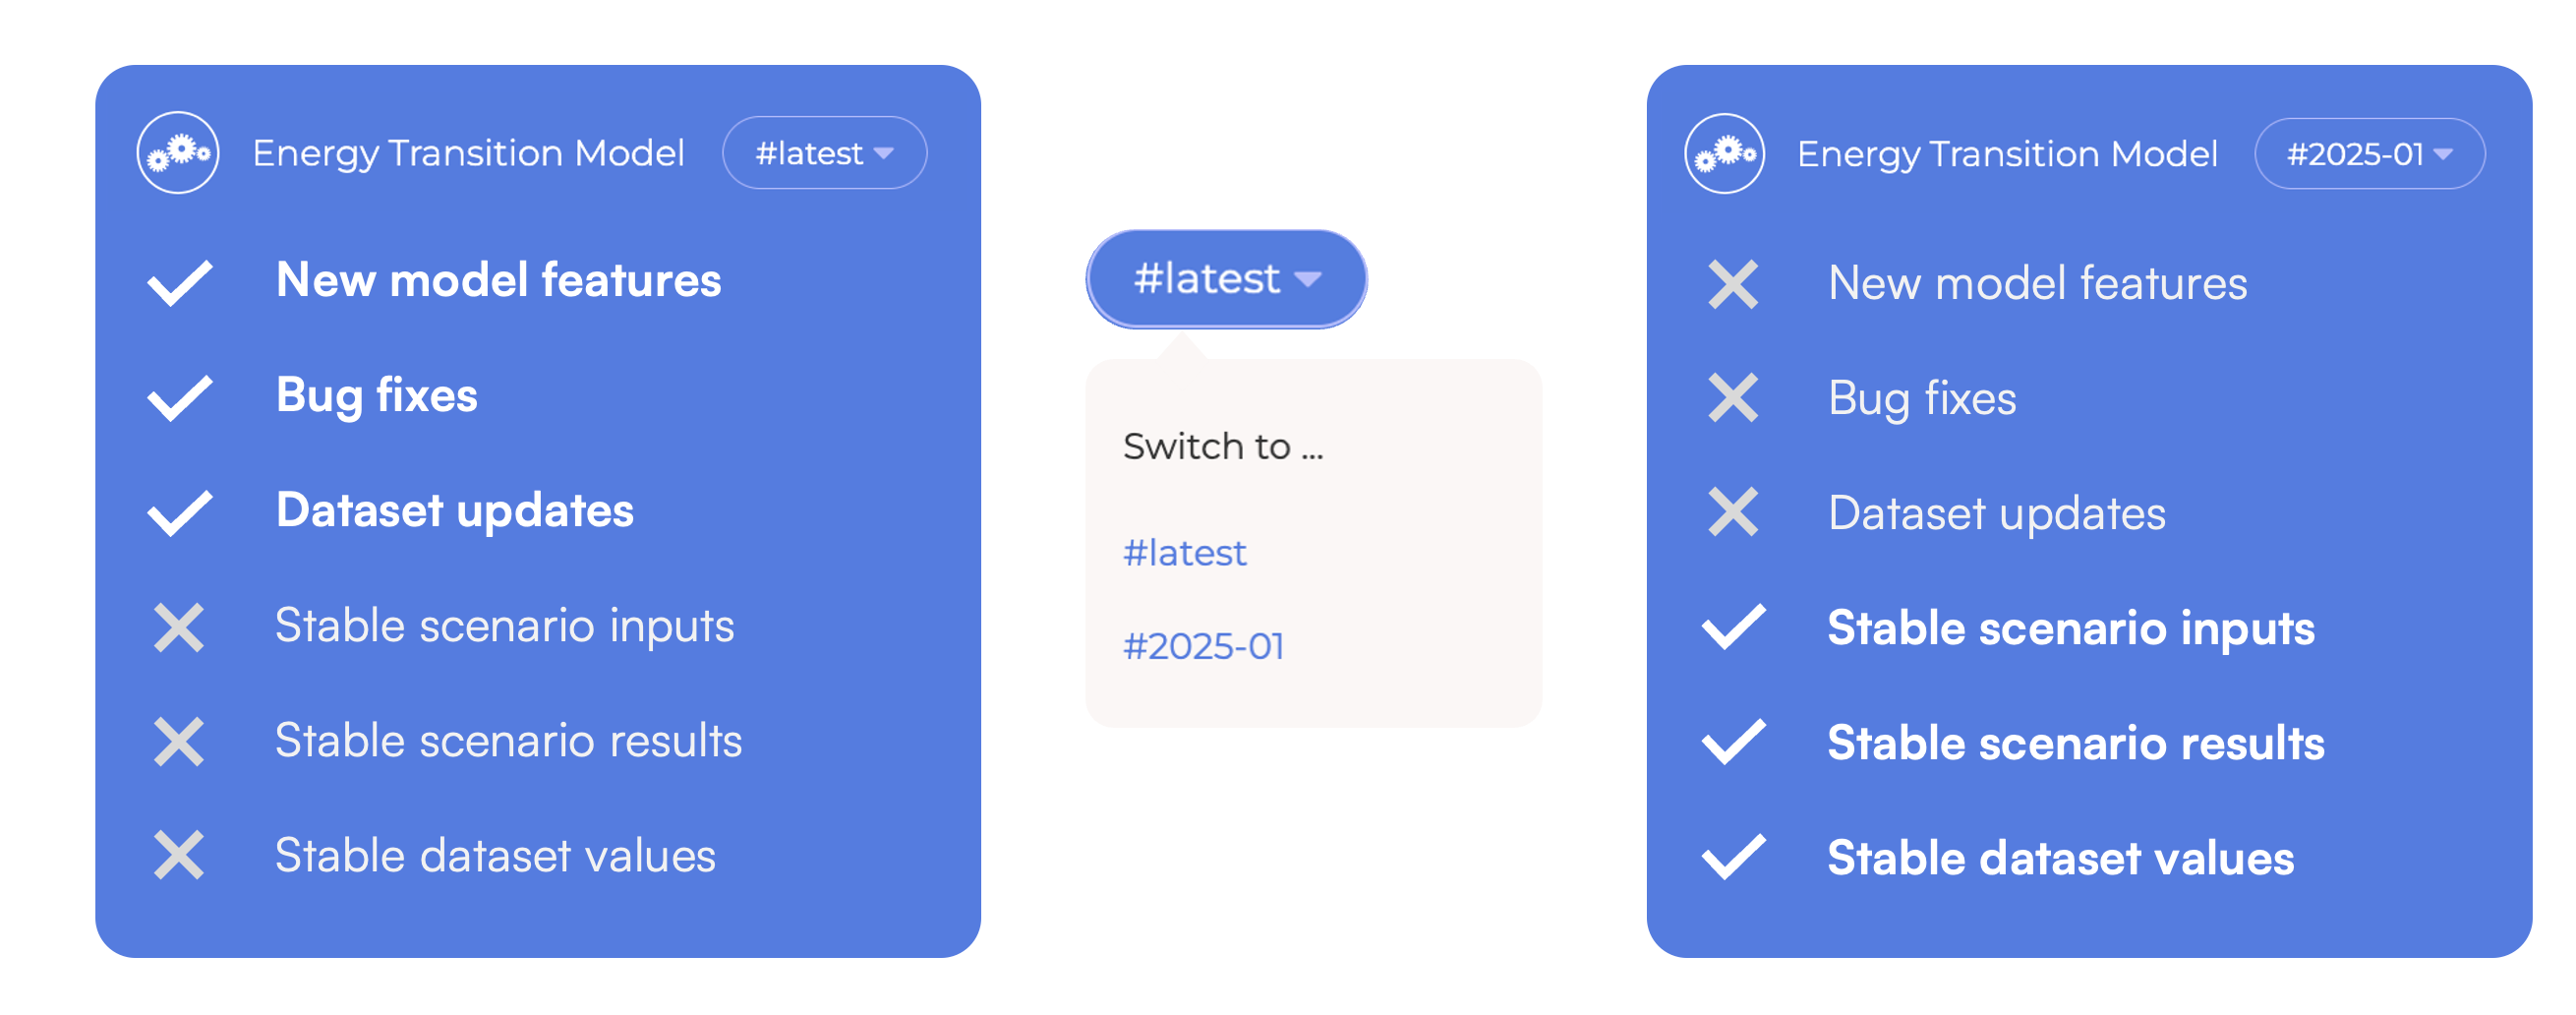
The default and stable version of the model are at this moment exactly the same, but as #latest will continue to be under development, it will over time diverge from #2025-01. The release of the stable version does not affect any of the scenarios created before the release. For more information about stable versions and how to move scenarios to the stable version, see the documentation.
Other new features
- It is now possible to download an overview of all slider settings of a scenario in the Data export section.
- Improvements of the start year data related to final demand in agriculture for the municipality of Noordoostpolder. Consult the Dataset Manager to view this dataset.
- Update of the chart “Final energy demand in other sector” where the carriers are now split into energetic and non-energetic (feedstock) demand.
Bug fixes
- There was an issue in modelling losses related to the treatment of natural gas extraction. This led to a mismatch between calculations for the annual and hourly natural gas balance and to an overestimation of natural gas imports in certain scenarios. This issue is now fixed.
- The charts in Collections that show the final demand ‘by carrier’ and ‘by sector by carrier’ were not aligned. This caused a discrepancy between these charts in the total final demand of Liquid biofuels and Oil and oil products. These charts have now been aligned to resolve this discrepancy.
- Greenhouse gas emissions from the Other sector were missing from the Greenhouse gas footprint visual. These are now included in the visual under Industry, Energy & Other.
- Under certain conditions, the forecasting algorithm for electricity storage caused invalid hourly electricity prices to emerge during curtailment. This issue is now fixed and the electricity price becomes 0 €/MWh in hours with curtailment.
- The electricity used in demand side response (DSR) in the central ICT sector was not taken into account in all calculations for final demand. This issue is now fixed.
- The output capacity of large-scale batteries (including battery systems combined with onshore wind and onshore solar PV) and flow batteries is set equal to the input capacity, in line with other storage technologies. As a result, the installed output capacity of these storage technologies might have slightly changed in existing scenarios.
Technical changelog
- No relevant changes to inputs have been made.
March 2025
New features
- Version tags are now used for “Saved scenarios” and “Collections” in API responses (in preparation of releasing a stable version of the ETM). Read more about changes to the API in the API changelog.
Bug fixes
- The full load hours slider for solar PV did not alway correctly adjust the full load hours and production of all solar PV technologies. This is now fixed so that solar PV production matches the full load hour settings.
- Changes in the full load hours led to inconsistent energy flows in solar PV plants for H2 and offshore wind turbines for H2 between the electricity and hydrogen production component. This is solved to ensure that flows between these components are consistent.
- An issue in the curtailment settings for solar PV led to the wrong calculation of the peak production before curtailment. This issue is fixed, the correct peak production before curtailment is given. The production after curtailment remains unaffected.
- Due to a bug in the weather year set (only for Dutch regions), the weather year settings did not change the annual heat demand of households. This bug is fixed.
- The slider for turning off appliances in the Behaviour section of Households also affected the energy demand in the Buildings sector. This is rectified, the slider now only affects energy demand for appliances in the Households sector.
Technical changelog
- No relevant changes to inputs have been made
February 2025
New features
- New setup of the “My Scenarios” and “My Account” pages
- A central environment is introduced to manage saved scenarios, Collections, and account settings
- Use this to:
- Manage and share saved scenarios
- Generate Personal Access Tokens
- Subscribe to the newsletter
- Update personal infomation
- The “Transition Path Charts” or “Multi Year Charts” tool is renamed to “Collections”
- The prefix in the URL has been changed from
myctocollections - A “Collection” is a set of saved scenarios that can be created in “My Scenarios”
- A “Transition Path” is a type of “Collection”, where a single saved scenario is interpolated to intermediate years
- The prefix in the URL has been changed from
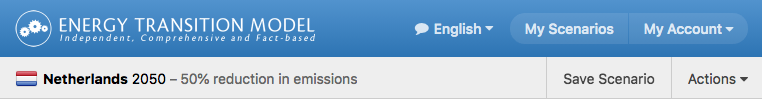
- New charts added to the chart selection:
- ‘Electricity supply and demand’
- ‘Network gas supply and demand’
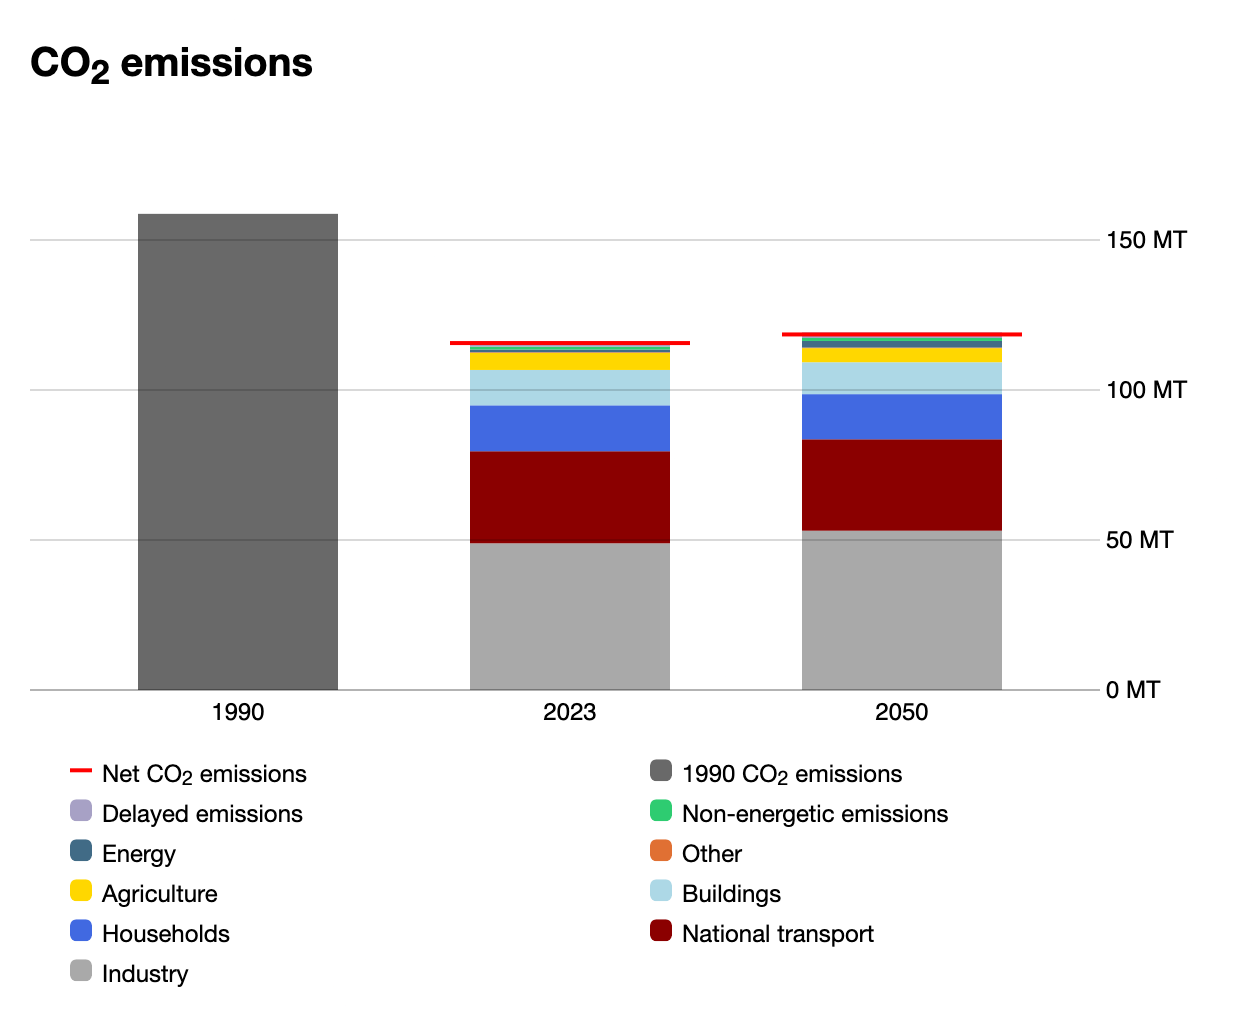
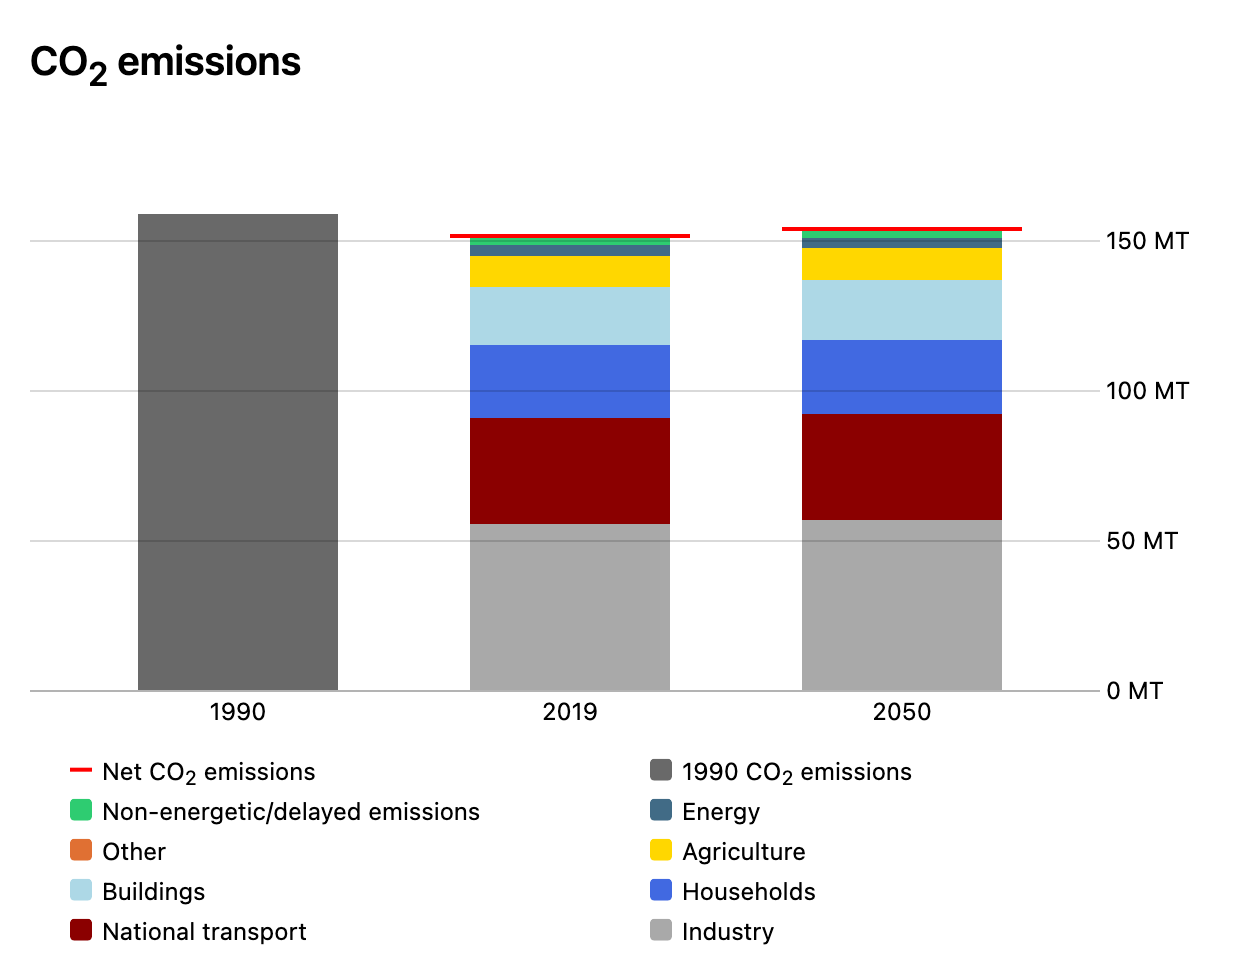
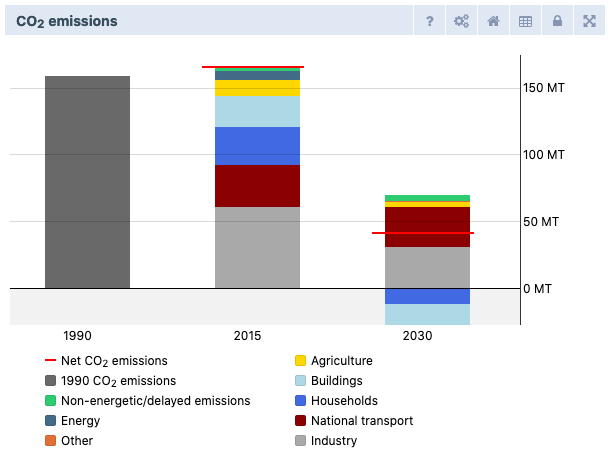
- Improvements for non-energetic CO2 emissions to better facilitate the comparison between 1990, the start, and future year:
- Split of non-energetic and delayed emissions in the ‘CO2 emissions’ chart to separate categories
- Update in ‘CO2 emissions’ chart description regarding non-energetic emissions
- Update of documentation regarding non-energetic emissions in 1990 and those modelled in the ETM
- Climate and Energy Outlook (Klimaat- en Energieverkenning, KEV) 2024 added as featured scenario for future year 2030 en 2035
- Start year data improvements for the municipality of Emmen, regarding the chemical and other industry sectors
- Update of the dataset of Antwerp from to start year 2022
- Further improvements to our automatic testing suite that checks the model’s calculations
Bug fixes
- Fixed a minor discrepancy between the calculated hourly and annual electricity flows for load shifting in the ICT sector
- Added missing technology hybrid air heat pump (oil-fired) to chart ‘Number of residences per space heating technology’
- Added missing natural gas export hourly demand profile to the data-export ‘Network gas demand, production and storage per hour’
- Correction in biomass to heat flow in ‘Energy flow overview’ (Sankey) chart to avoid double counting of green gas flows
- Redesign of chart ‘Net flow of refinery products’ to visualize transformation of non-oil energy carriers when coupled to an external industry model
- Fixed behaviour of external coupling for must-run interconnectors
- Minor correction in aviation emissions in municipal datasets
- Fix in Collections to correct for double-counting of green gas in final demand series
- Correction in chart ‘Total greenhouse gas emissions (CO2 eq)’ to ensure that depicted CO2 emissions are aligned with ‘CO2 emissions’ chart
Technical changelog
January 2025
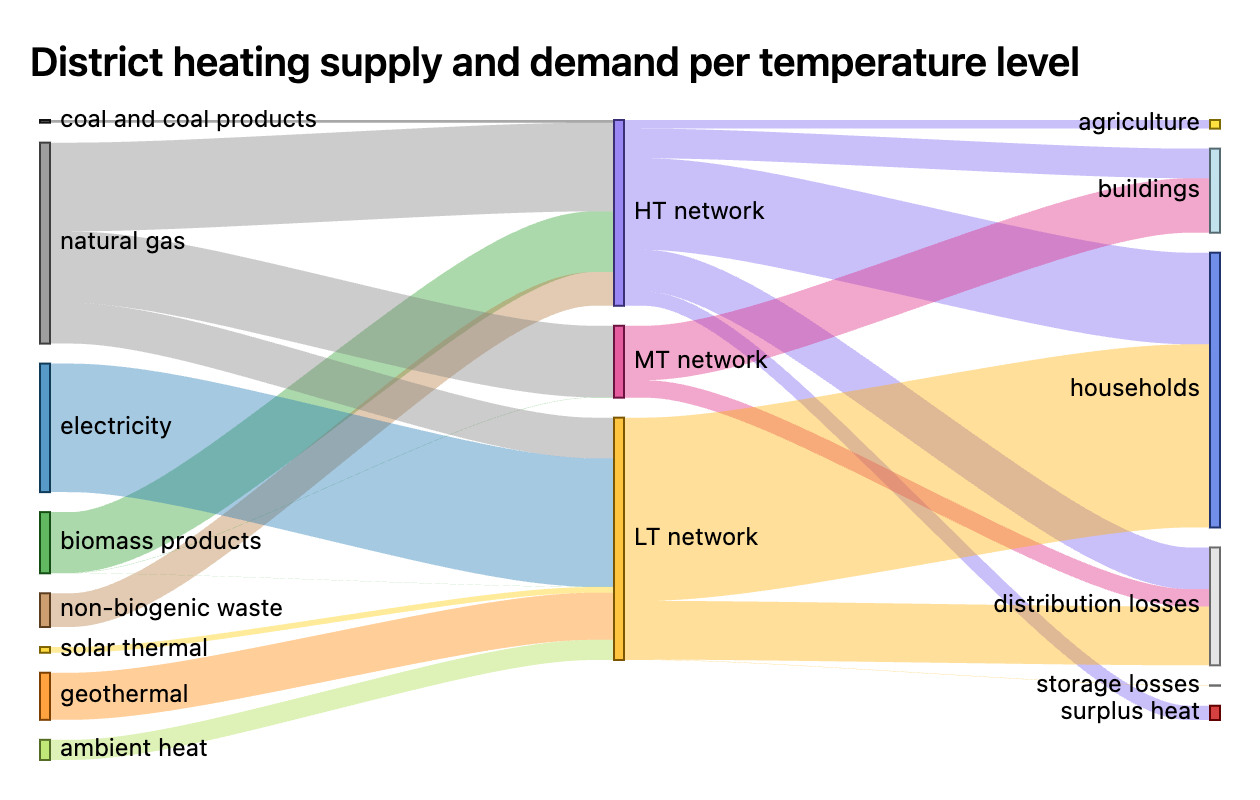
New charts added for supply and demand in district heating per temperature level (HT, MT, LT). Check out these supply and demand charts in the chart overview in the ETM. Furthermore, miscellaneous bug fixes and improvements are done this month.
November 2024
Additions and improvements for European countries
The countries Norway, Serbia and Switzerland, as well as Great Britain are now available in the ETM. Check out the new countries by selecting them in the region dropdown when starting a new scenario.
For a complete overview of all data that has been used to create the country datasets, have a look at the ETM Dataset Manager. The final energy demand of the countries is matched as much as possible to the country energy balances. As always, there is some room for future improvements, particularly regarding heat and electricity production data. However, we are very excited about this first step of making the new datasets available. Feel free to contact us with suggestions using the contact form.
In addition, improvements have been made of carrier application splits in households for all European country datasets in the ETM, based on the Eurostat final energy consumption in households database. The assumed values in application splits can be found in the ETM Dataset Manager as well. Later in November, this update will be followed by an update of the residential and non-residential building stock, based on numbers from the EU Building Stock Observatory.
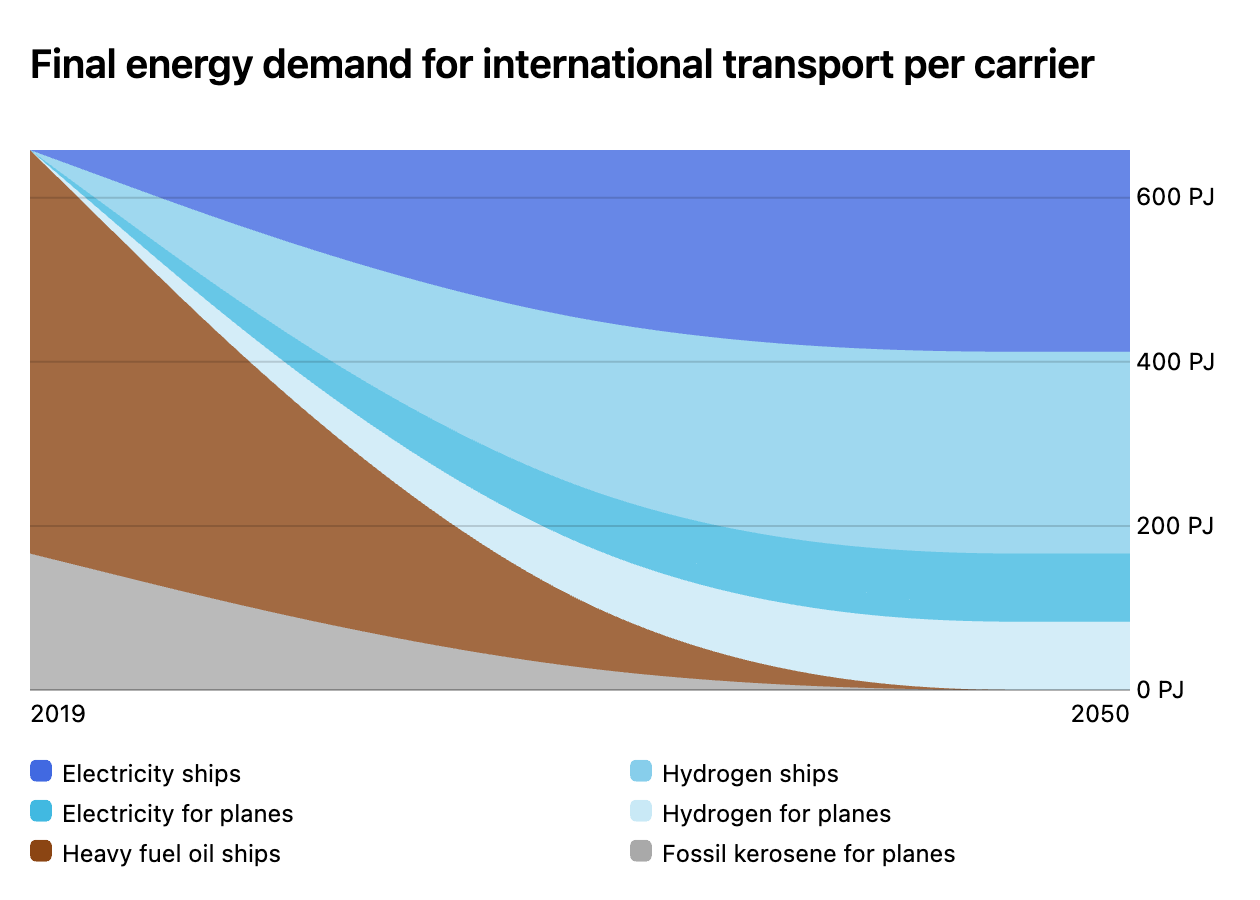
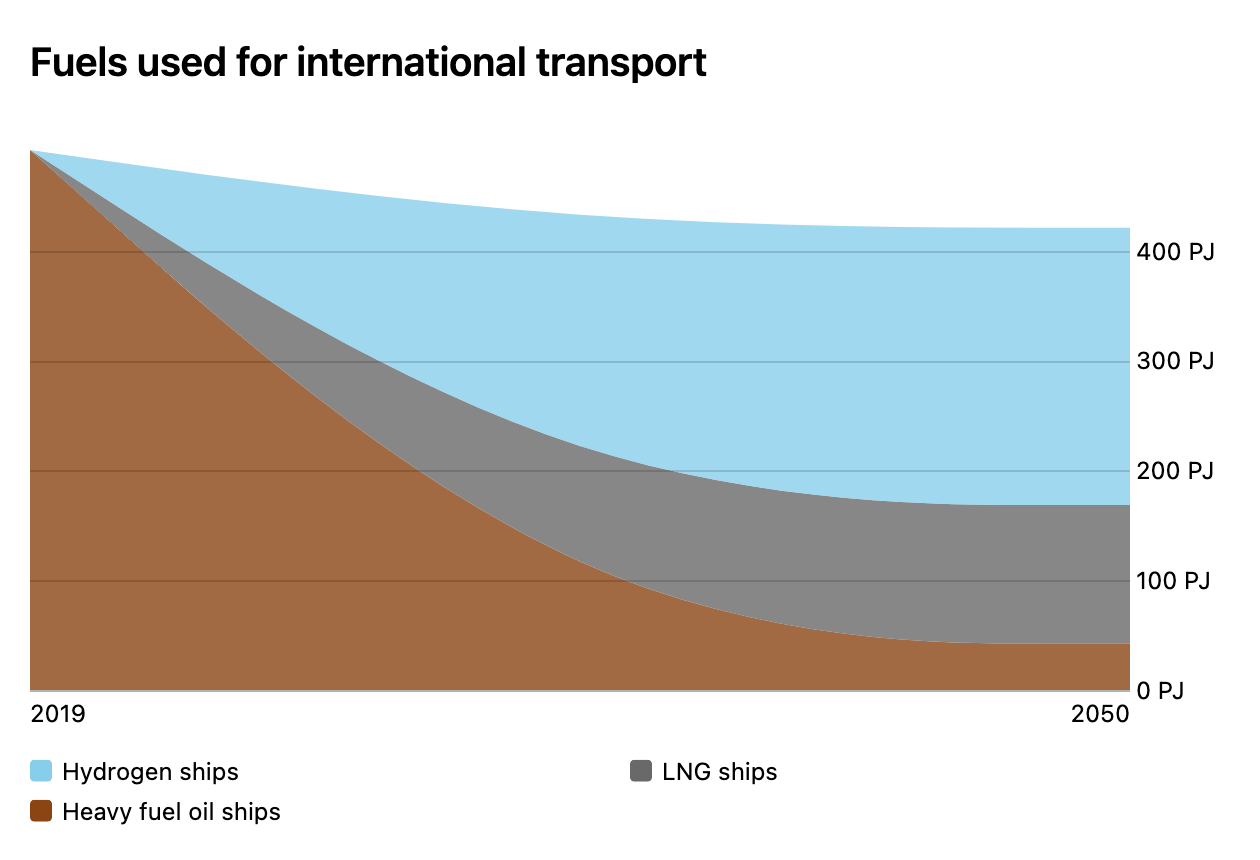
Addition of hydrogen and electricity for international transport
Hydrogen and electricity can now both be used to model the demand of international transport. In the International transport section you can model the demand for international transport in your scenario. The modes of transport you can choose from are navigation (by ship) & aviation (by plane). Now you can use hydrogen and electricity as a way to serve the demand for both these modes of transport.
September 2024
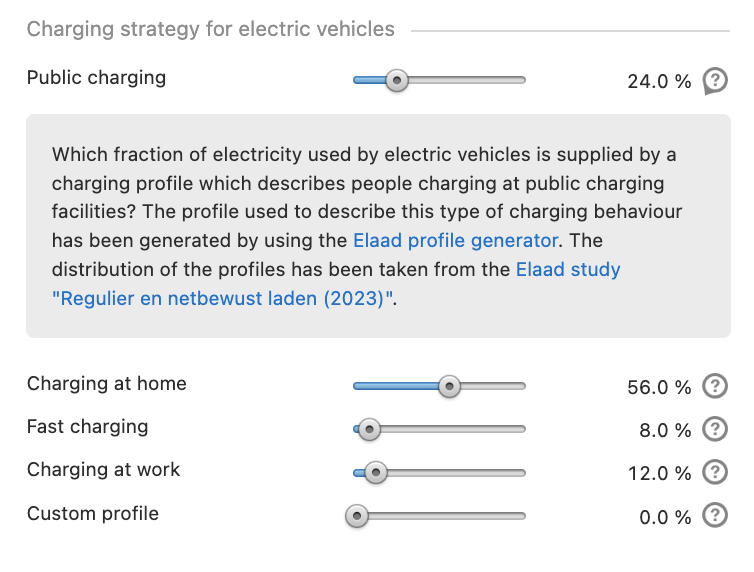
Update profiles electric vehicles
The electric vehicle load profile section has been updated!
We have updated both the standard settings for the profiles, and updated them with new profiles.
Explore this new update in the Demand response - electric vehicles section.
July 2024
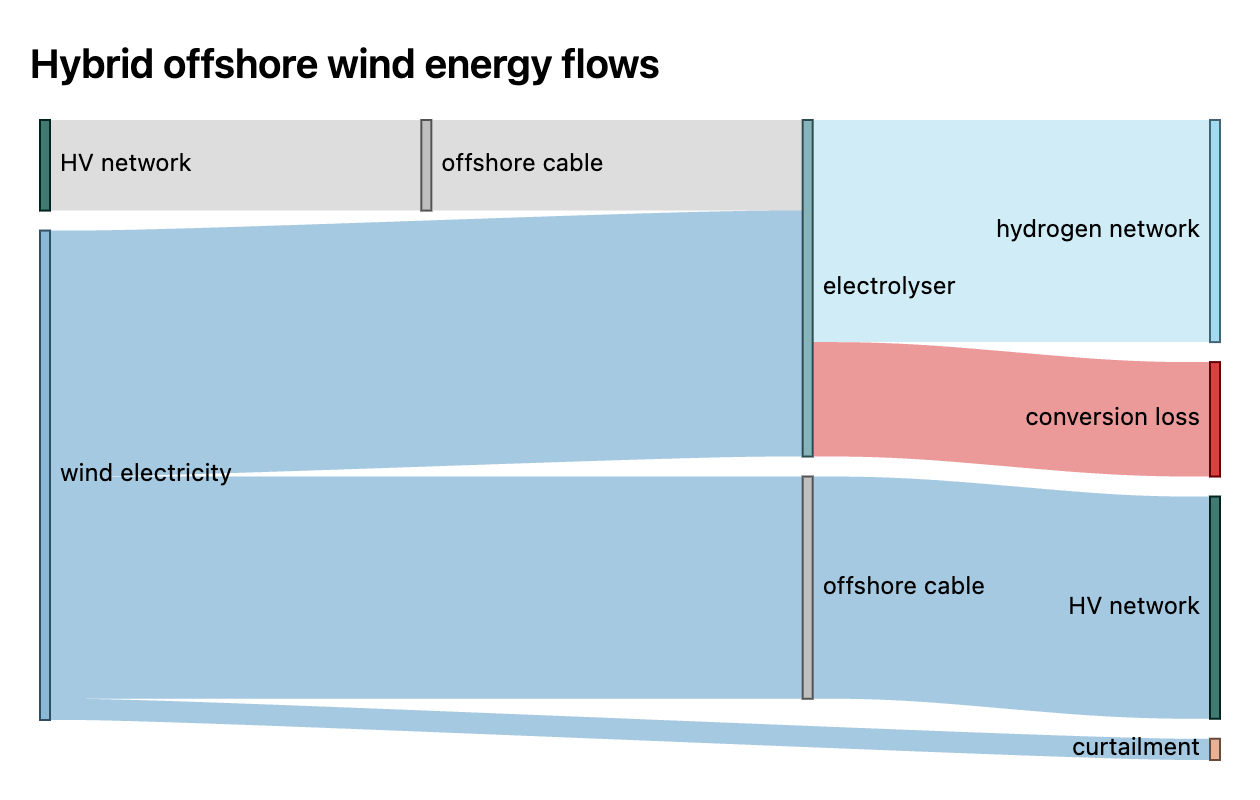
Hybrid offshore wind
It is now possible to explore the role of hybrid offshore wind in future energy systems. The hybrid offshore wind turbines can deliver generated power to the onshore HV network or to an offshore electrolyser. The offshore electrolyser can also receive power from the HV network for hydrogen production.
Explore the new possibilities by setting the installed capacity of the hybrid offshore wind turbines in the Renewable electricity section. Additionally, the relative capacities of the electrolyser and offshore cabling can be set in the Flexibility section.
New charts and a table have also been added to provide insights into the installed capacities, peak load, and annual energy flows of the hybrid offshore wind components. The Sankey diagram below, for example, shows how much energy flows between the components on an annual basis. Explore the new user output yourself in the ETM’s list of charts.
Scenario collections
Create collections of saved scenarios and compare their outcomes. The new tab in My Scenarios contains both your collections, and your transition paths.
Use the new button in the collections tab in My Scenarios to start creating a new collection. Up to six scenarios you have rights to can be added to your collection.

You can share the link to your collection with anyone, but only people that you have given access to the scenarios will be able to see them in the viewer.
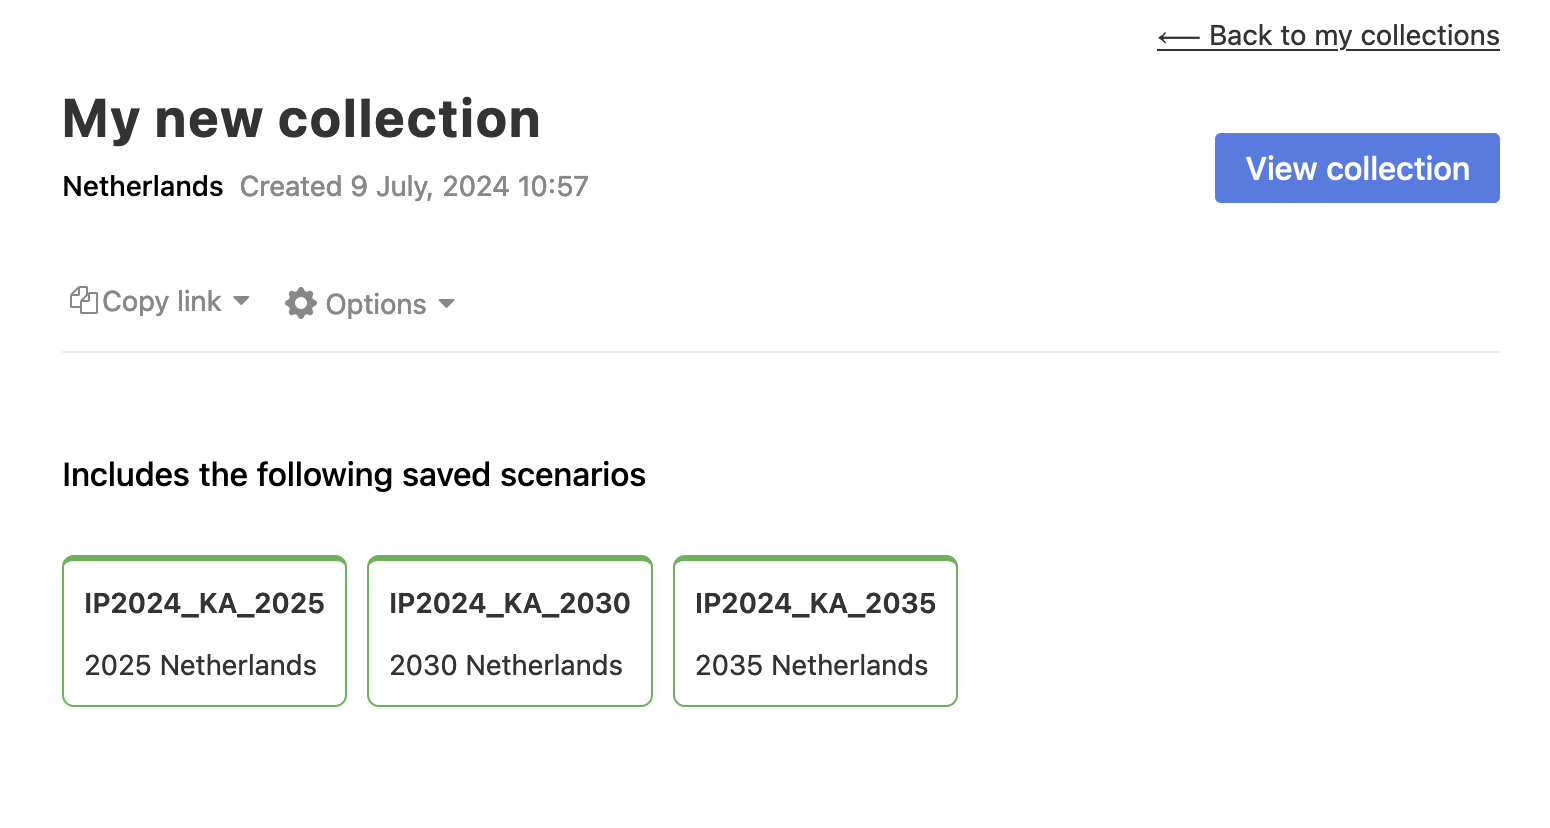
Opening the collection will open a new viewer, where you can compare your scenarios using the same charts as known from the existing transition paths feature.
May 2024
Addition of BECCUS
The ETM now incorporates Bioenergy with Carbon Capture and Utilisation Storage (BECCUS) plants. There are three key updates to explore.
First, biomass power plants have been added to the model. Users can now install capacity for either must-run or dispatchable biomass power plants and CHPs in the Biomass plants section.
Second, it is possible to capture CO2-emissions from these power plants, by determining which part of the installed capacity is fitted with a CCS unit. This can be set in the Capture of CO2 in energy sector section.
Third, a price for captured biogenic CO2 has been introduced in the model. This price can be set in the the CCUS section. The revenue that can be obtained from captured biogenic CO2 is taken into account when determining the marginal costs of power plants or CHPs that run on biogenc fuels and have a CCS unit. It allows these plants to run for lower marginal costs. The costs of all captured biogenic CO2 is shown in the costs charts.
Hydrogen improvements
The hydrogen section of the model has been improved! Now, flexible production options have been added. Steam methane reformers, ammonia reformers and autothermal reformers can be installed with dispatchable capacity in addition to the must-run variant of these hydrogen reformer techniques. Explore these changes in the Hydrogen production section.
Next to these flexible producers, the modelling of hydrogen storage has been refined. Now, users can use salt caverns and depleted gas fields as storage options in the model. In addition, users can set both the volume and capacity for these storage options. These features can be found in the Hydrogen storage section.
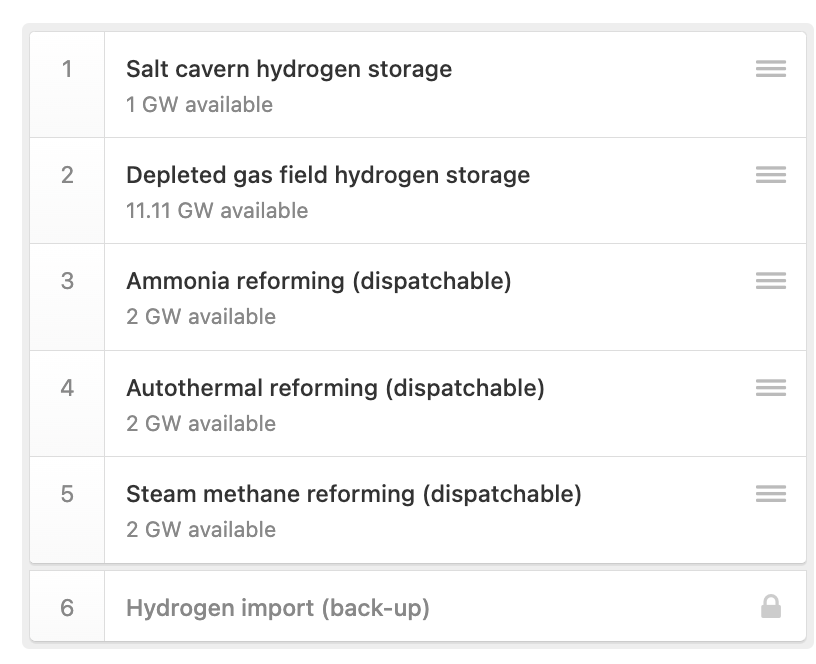
Together the dispatchable and storage production facilities make up for the flexible hydrogen production routes within the ETM. Which production route should be used first, can be installed by the user via the new hydrogen production merit order. The merit order of production can be set in the Merit order of dispatchable hydrogen production section.
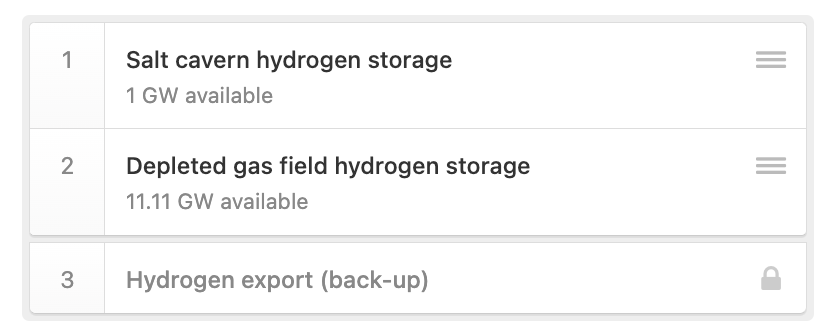
The flexible demand options, which are the two hydrogen storage options for now, can be installed via the new hydrogen demand merit order. The merit order of demand can be set in the Merit order of dispatchable hydrogen demand section.
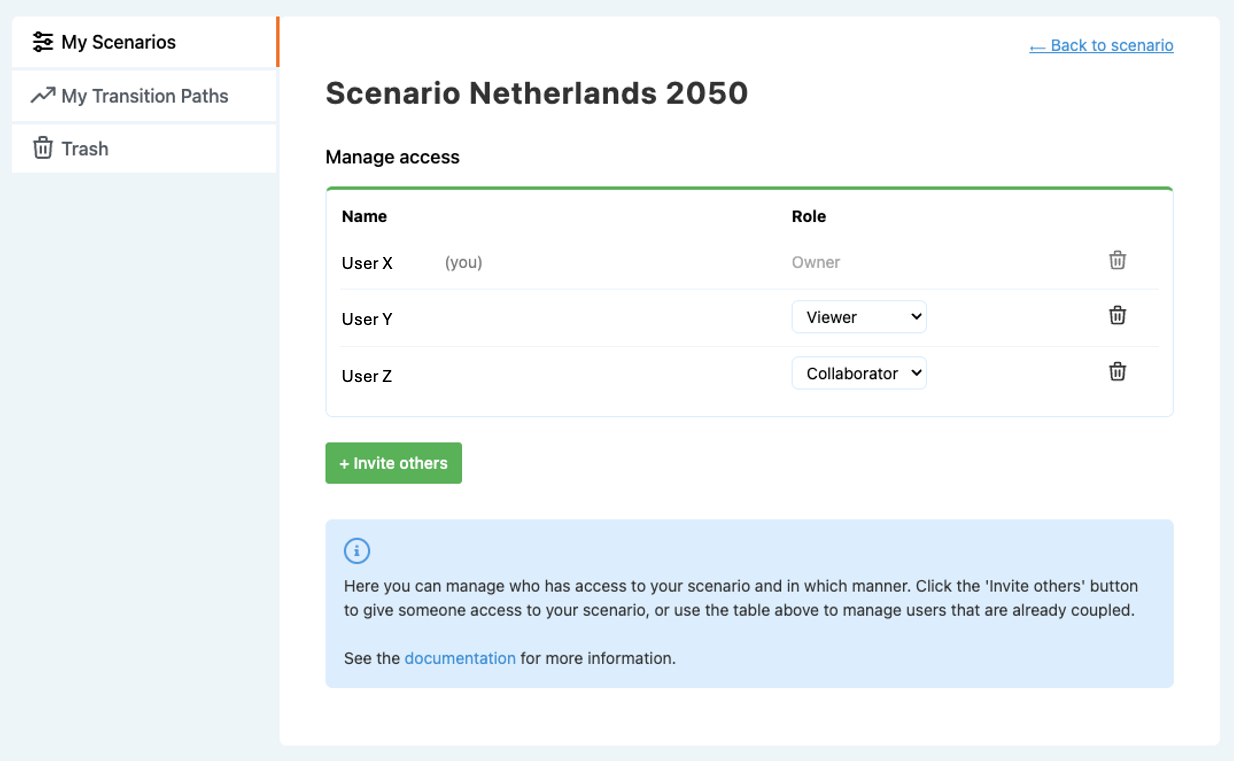
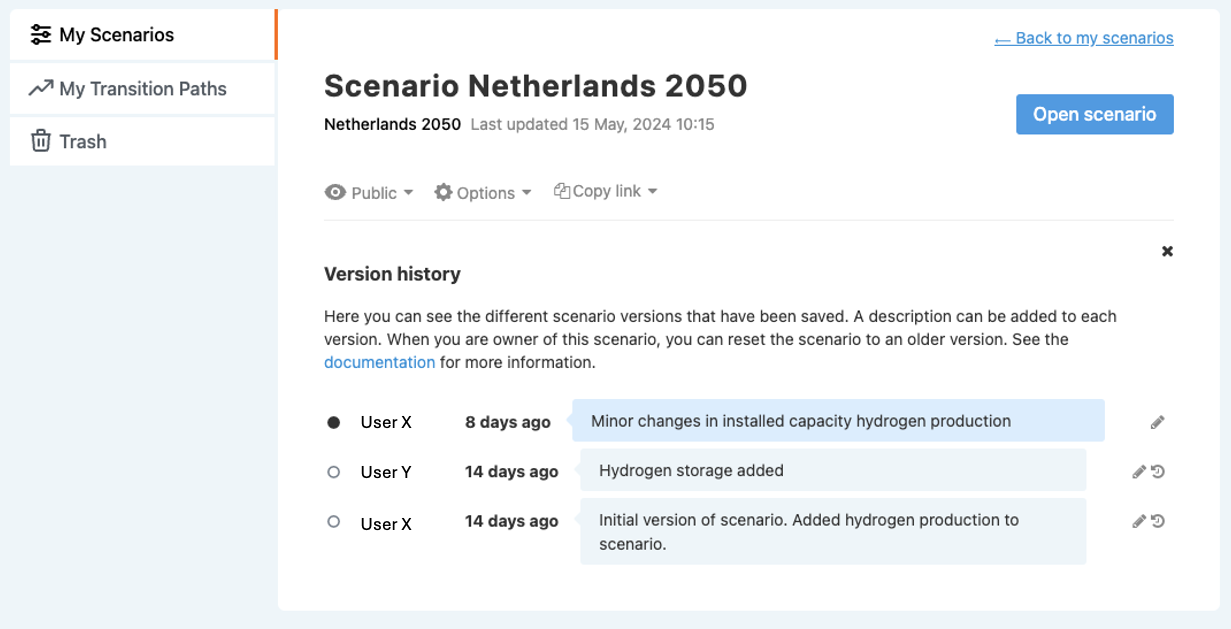
Multi-user support and scenario version history
It is now possible to collaborate with multiple users on a scenario. Through the My Scenarios overview, you can invite other users of the ETM to one of your scenarios as a Viewer, Collaborator, or Owner. You can also invite persons who don’t use the ETM as of yet. Depending on the rights granted, the invitee can view your scenario, make edits and even invite other users to your scenario.
Also, there is now an overview available of the version history of scenarios. This shows old versions of a scenario along with the user who last modified it. You can open the old scenario versions in the ETM, add a description to old versions and restore old scenario versions.
March 2024
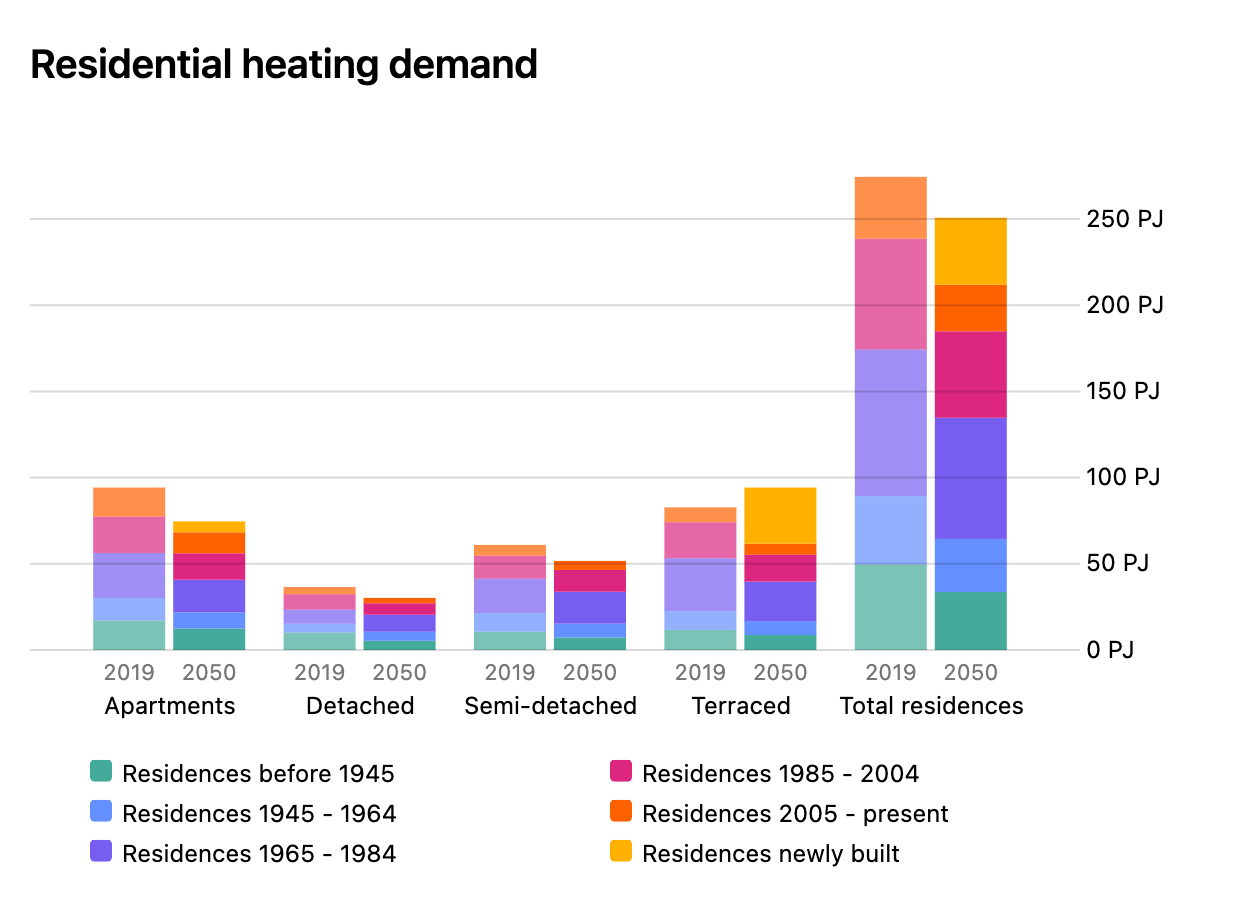
Heat modelling in the built environment has been thoroughly revised
The building stock is now disaggregated at a higher level of detail. Households are differentiated by combinations of housing type and construction period, including new construction. For buildings (services) existing and new buildings are distinguished. Additionally, users can set a prioritization to distribute heating technologies across the housing stock. Also, users now have insight into heat deficits per housing category, they can adjust the installed capacities of heating technologies, and have the ability to set two different representations of the thermostat profile per combination of technology and building category. Development of heat demand can also be set per building category in kWh/m2.
Explore the new heat modelling in the Households and Buildings sections.
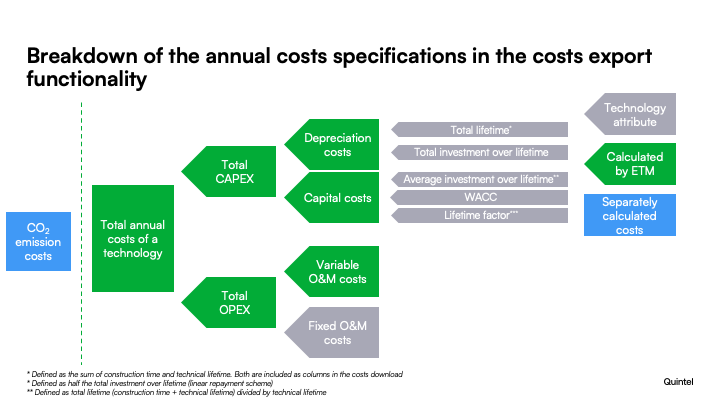
Costs export functionality updated & expanded
The costs export functionality of the ETM has undergone a major update! The download now provides much more detailed information on a scenario’s costs. Starting with total costs, total CAPEX and total OPEX, the csv file provides further details on the constituents of CAPEX and OPEX and the parameters underlying CAPEX calculations, such as the technical lifetime. In all, the costs export functionality now more truthfully mirrors the ETM’s costs calculating capabilities; see the image below.
Solar PV households and buildings capacity sliders moved to Supply
The sliders for solar PV capacities on rooftops of households and buildings now allow users to directly indicate installed capacities for these technologies (in MW). The sliders have been moved to the Renewable electricity section.
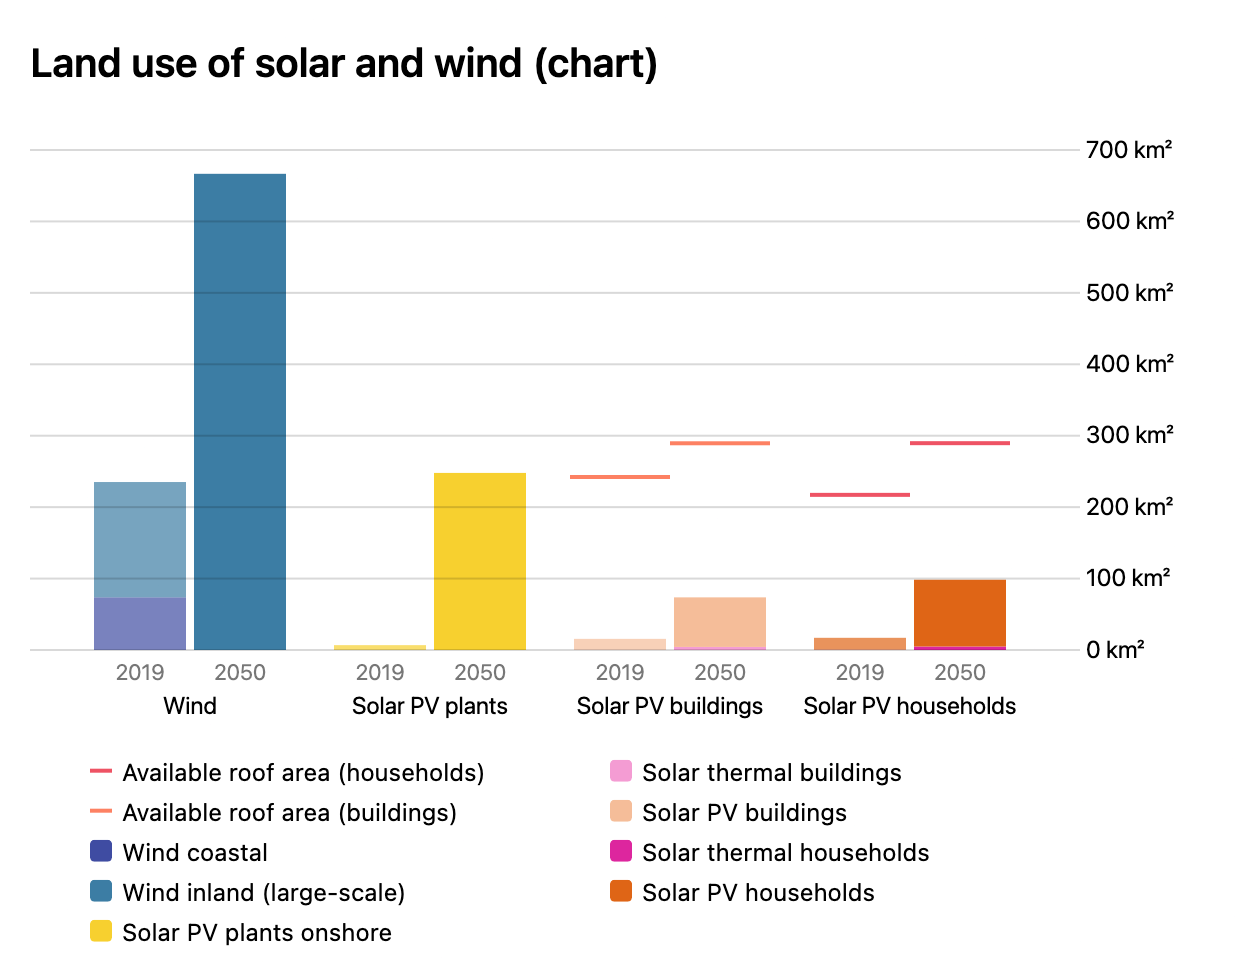
Land use of solar and wind visualization available
The ETM now contains a chart displaying the land use of solar panels and wind turbines on land. The chart also allows the user to virtually distinguish large scale and small scale wind turbines without affecting the actual scenario. The accompanying table provides more detailed information on e.g. capacities and electricity production of all included technologies.
Propane added as constituent of network gas
Users of the ETM can now add propane as a constituent carrier in network gas. Addition of propane can be required to increase the energy content of network gas when mixing in other gases with a lower calorific value, such as biogas.
January 2024
Local forecasting for household batteries
You can now choose two types of forecasting for household batteries. The first is the existing system forecasting algorithm, which is available for all electricity storage technologies. The second is a new local forecasting algorithm. Instead of all the electricity demand and supply in a region, it only tries to match household electricity demand and supply. Both types of forecasting have a different impact on the electricity grid. Try it for yourself in the Flexibility section.
Input capacity for load shifting
Demand-side response in the industry has been updated. When applying load shifting in an industry sector, it is now possible to set the available capacity to increase the load seperately from the capacity to decrease the load. This makes it possible to reduce the impact of the increased load on the electricity grid. It can be found in the Flexibility section.
December 2023
Transit flows
Many regions deal with energy flows that merely pass through the region and are not consumed or produced by parts of the local energy system. Users can now gain more insight in these transit flows of energy carriers within their system. In order to model transit flows in your scenario, you can set the inflexible export volumes of several energy carriers. Setting an export flow also enforces an import flow for the system to be balanced.
New charts have been added which give an overview of the transit flows in the energy system. The new features can be found in the Demand section.
![]()
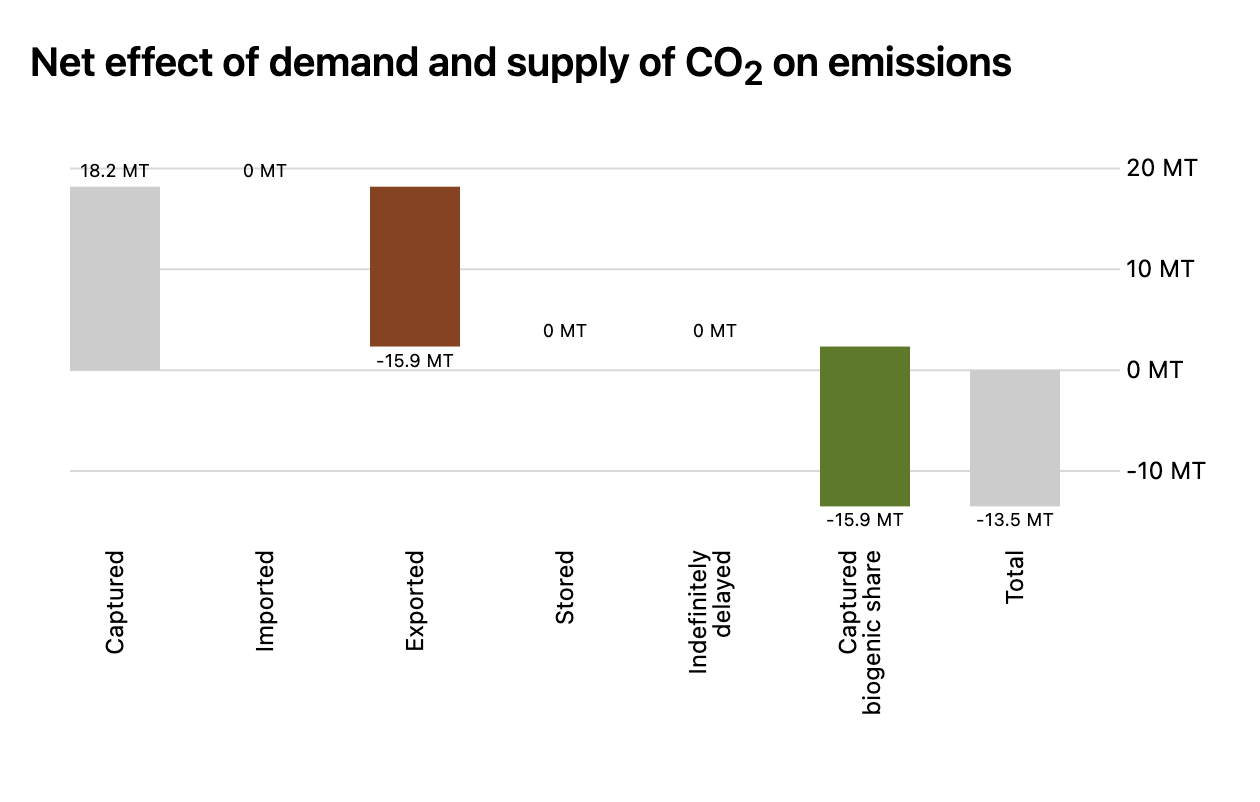
It is also possible to model a transit flow for CO2 by setting an import flow in Mton. See the Emissions section.
New hydrogen carriers
In addition 2 new hydrogen carriers have been added to the ETM:
Liquid organic hydrogen carriers (LOHC) — LOHCs are substances that can store and transport hydrogen in a liquid form. This form provides a higher energy density compared to gaseous hydrogen.
Liquid hydrogen (LH2) — At extremely low temperatures, hydrogen transitions from gaseous into liquid form. In liquid form it has a much higher volumetric energy density, leading to an advantage in transporting the hydrogen.
This allows for instance to import liquid hydrogen, reform it to produce gaseous hydrogen and export the latter. See the new hydrogen production technologies in the Supply section.
November 2023
Heat
There are a number of significant changes for the modelling of heat in the ETM. The following three main changes have been made.
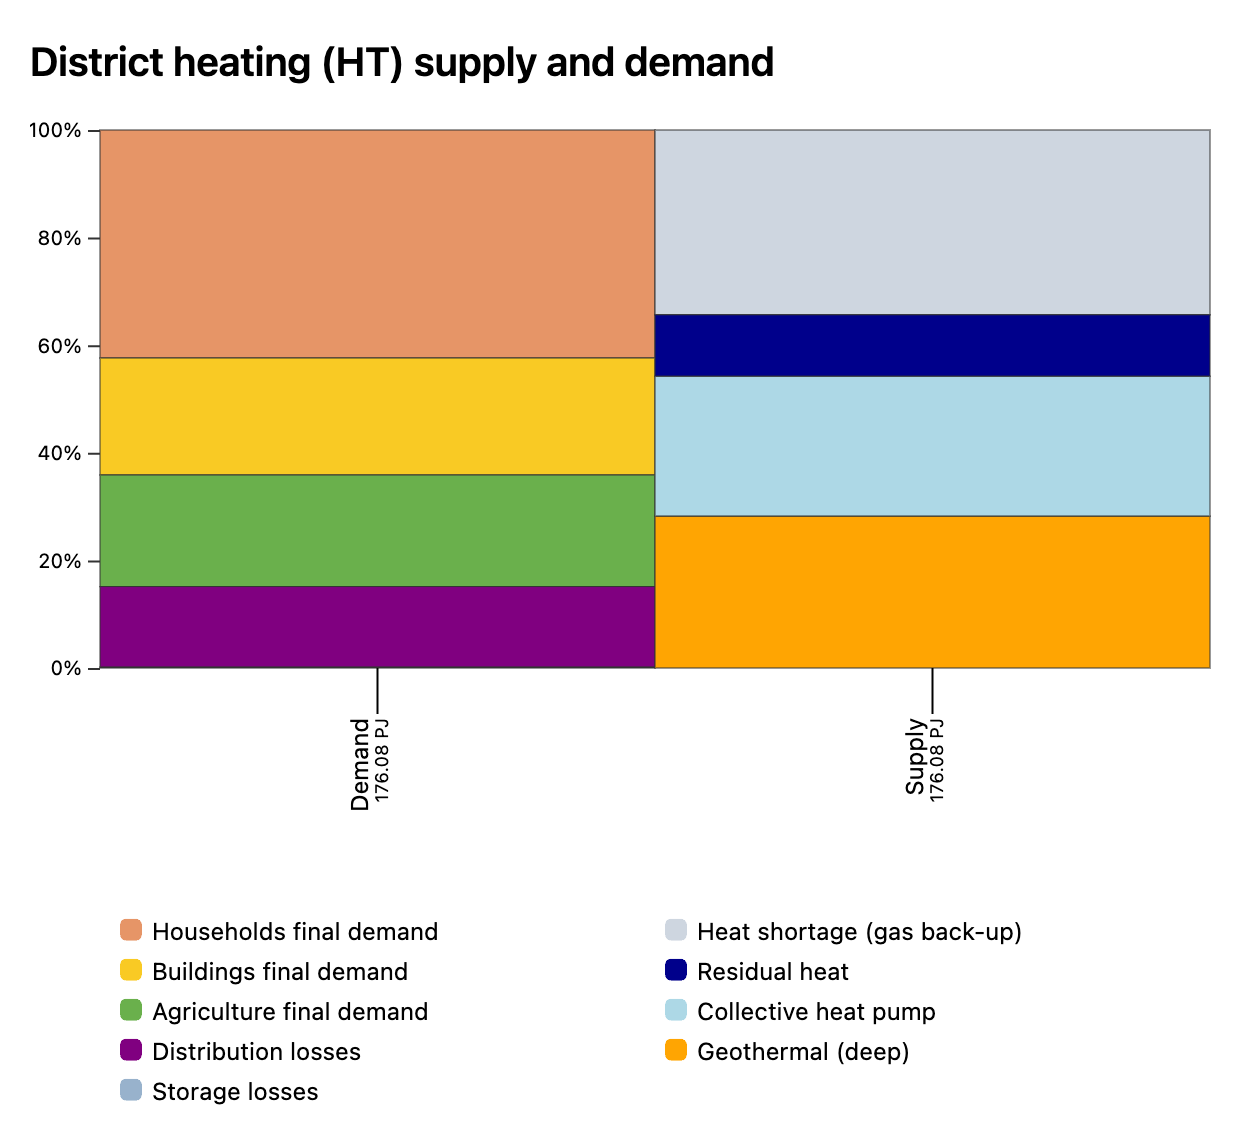
Temperature levels of district heating
District heating networks on different temperature levels can be specified: high temperature (HT), medium temperature (MT) and low temperature (LT). Each temperature level has distinct heat sources. You can set the demand, supply, storage and transport and losses for each temperature level. The costs of district heating infrastructure have been updated, using values specific for each temperature level. Finally, a number of charts have been added to help you set demand and supply. Explore the new District heating section to find out more.
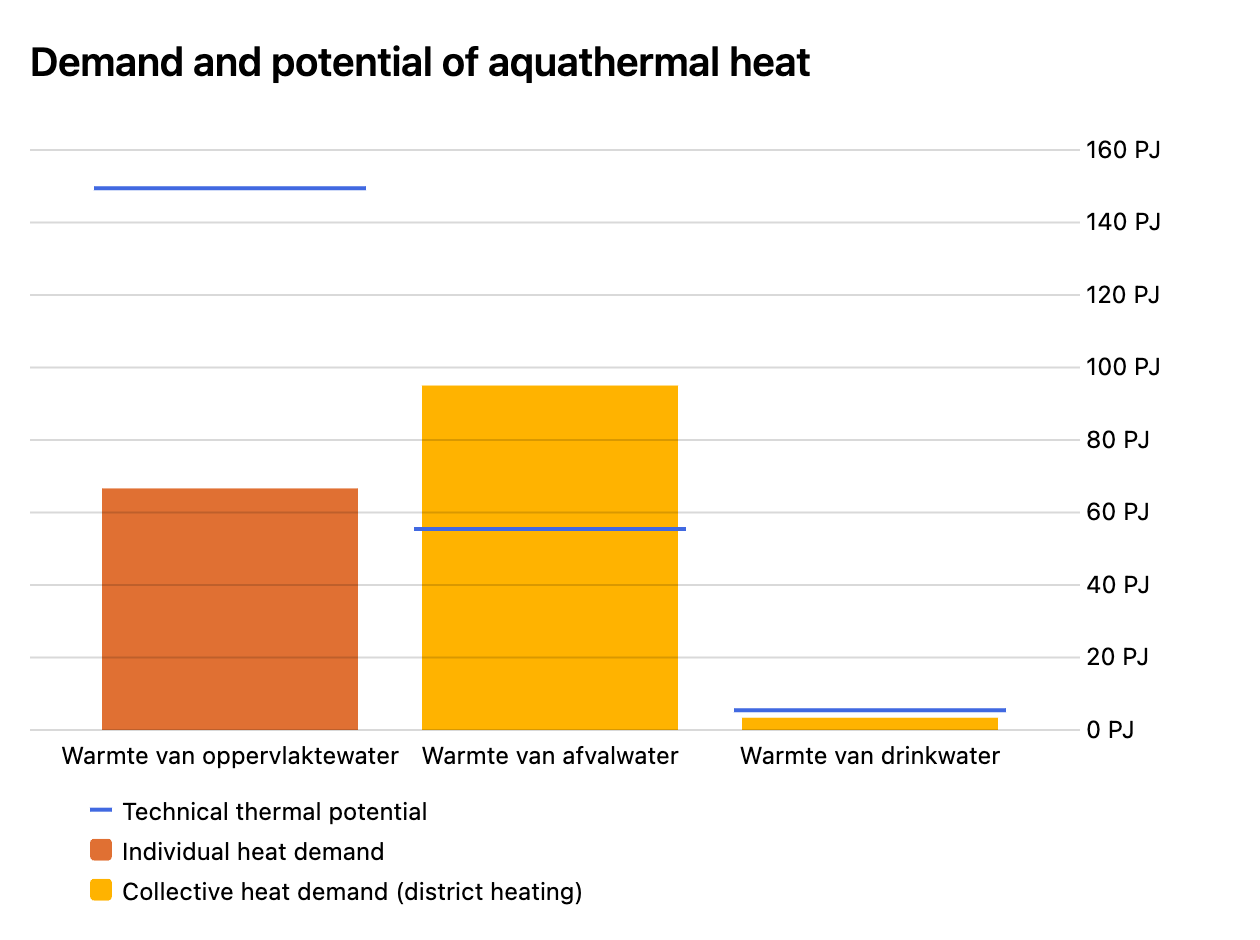
Aquathermal
Now, extra aquathermal technologies have been added to the ETM. Aquathermal refers to using water for heating and cooling. Three types of water reservoirs are taken into account: drink water, surface water and waste water.
Aquathermal technologies can be selected for invidiual residences, both for Space heating & hot water and for Cooling. This also applies to Space heating and Cooling in buildings. Additionally, aquathermal heat can be used in MT and LT district heating. A chart has been added that allows you to see the demand for aquathermal heat and compare it to the potential.
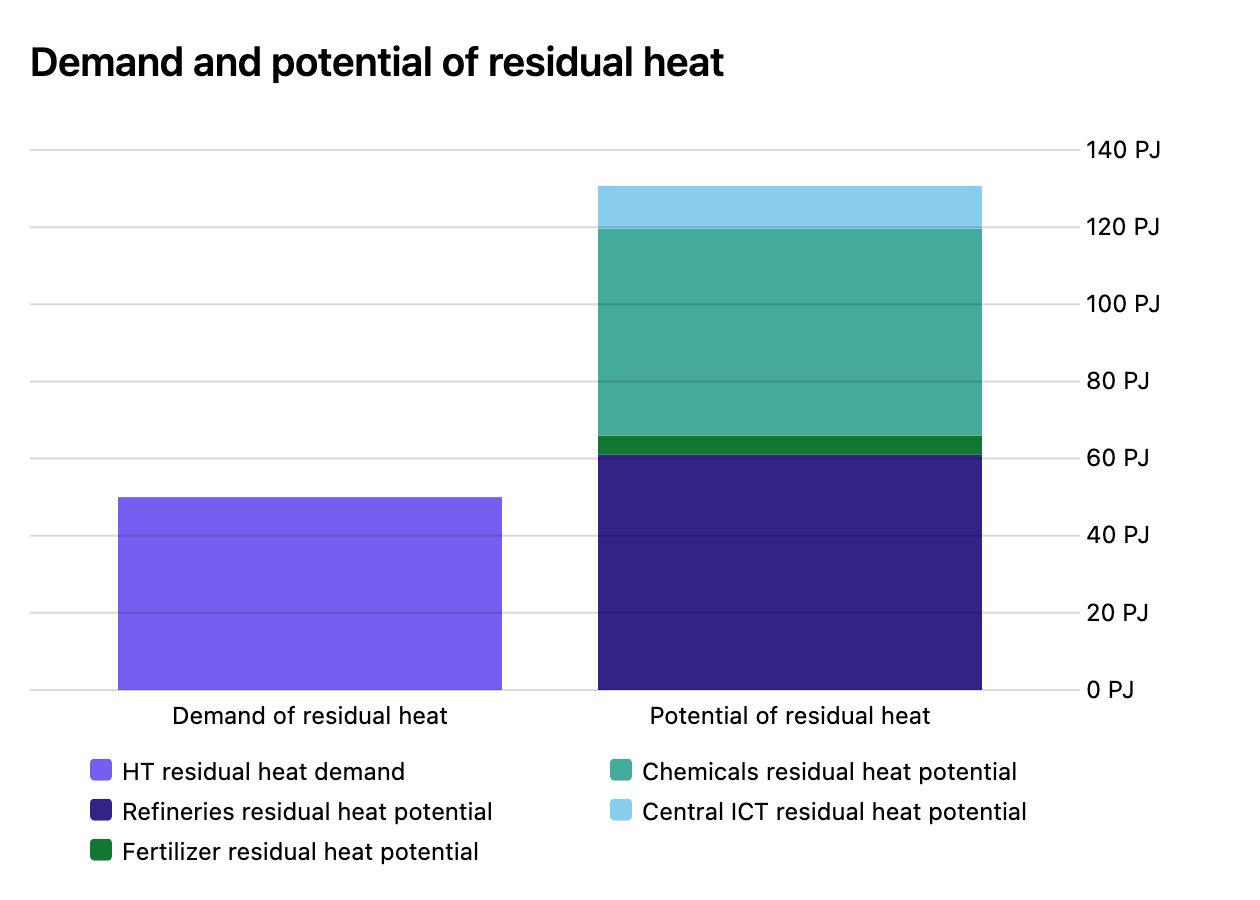
Residual heat
It is now possible to specify exactly the amount of residual heat you want to use in your scenario. You can then compare the demand for residual heat with an estimate of the potential in a new chart. The estimate of the potential depends on the respective size of the industry sectors.
June 2023
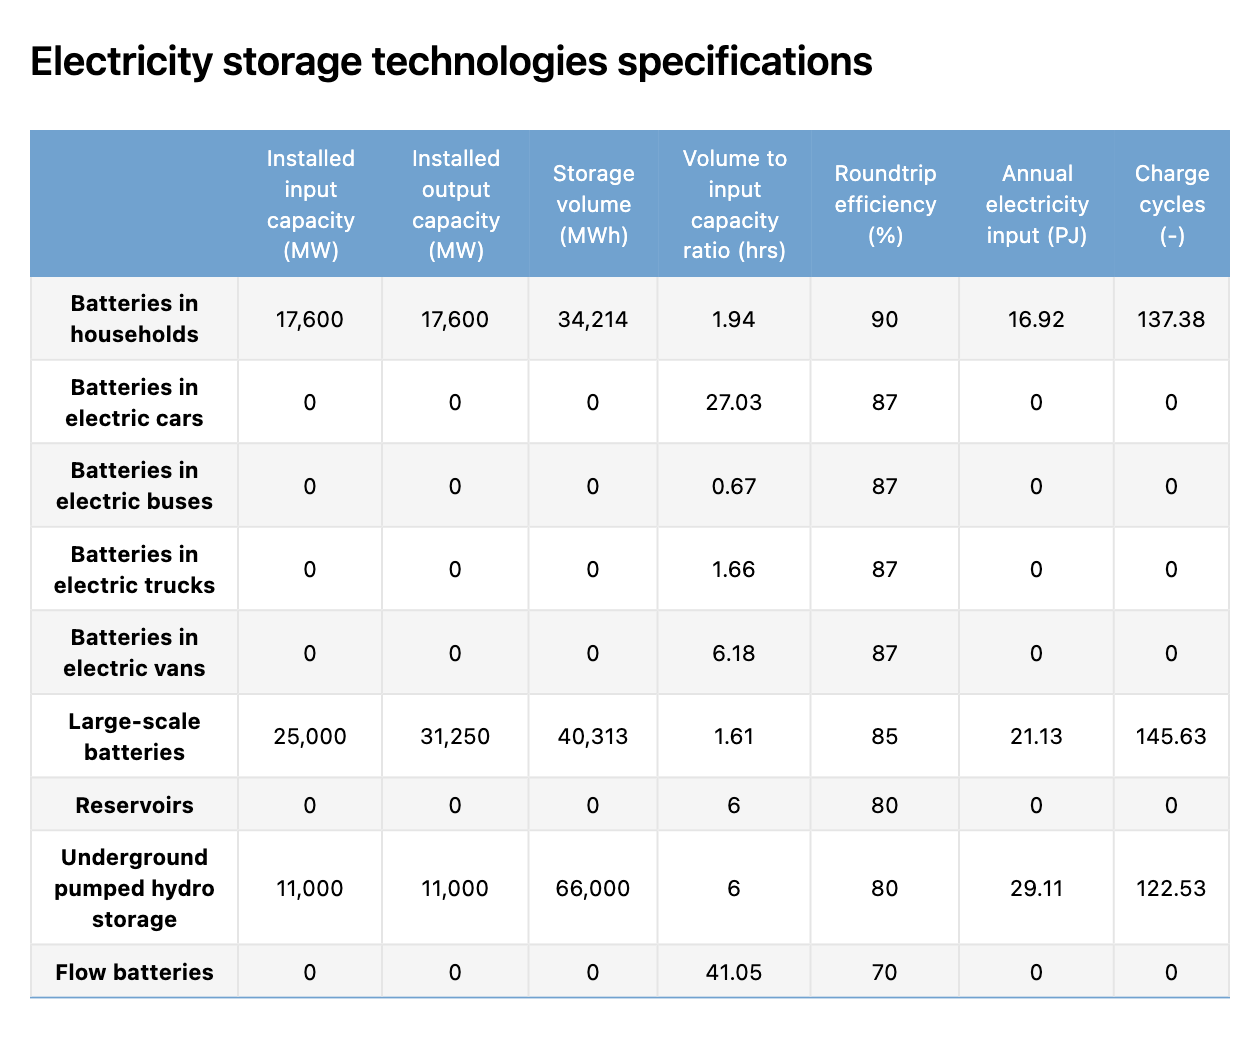
Adjustable specifications of electricity storage technologies
Two specifications of electricity storage technologies can now be customized in the model. The first is the roundtrip efficiency. You can adjust this in Costs & efficiencies → Flexibility → Electricity storage.
You can also change the relative storage volume of each technology in Flexibility → Electricity storage. The relative storage volume specifies how many hours a technology needs to charge at full capacity to go from 0% to 100% charged. Effectively it allows you to change the total installed storage volume for a given installed capacity.
In the table “Electricity storage technologies specifications” you can quickly compare the specifications across technologies:
March 2023
Local vs. Global tool is discontinued
The Local vs. Global tool is discontinued indefinitely. The tool allowed you to select multiple scenarios and see their combined results on a number of indicators. Though the functionality the tool offered is valuable, the limited scope of its implementation made it no longer worth the effort required to maintain it.

Our ambition is to further build on the Transition Paths tool instead. This tool has recently seen much development and offers a lot of flexibility for users who want to visualise and change multiple scenarios within a single interface. The functionality that the Local vs. Global tool offered may be incorporated in the Transition Paths tool in the future.
![]()
If you have any questions about the Local vs. Global tool, or would like to discuss suggestions for the improvement of the Transition Paths tool, please contact Quintel.
February 2023
New feature for electricity storage technologies
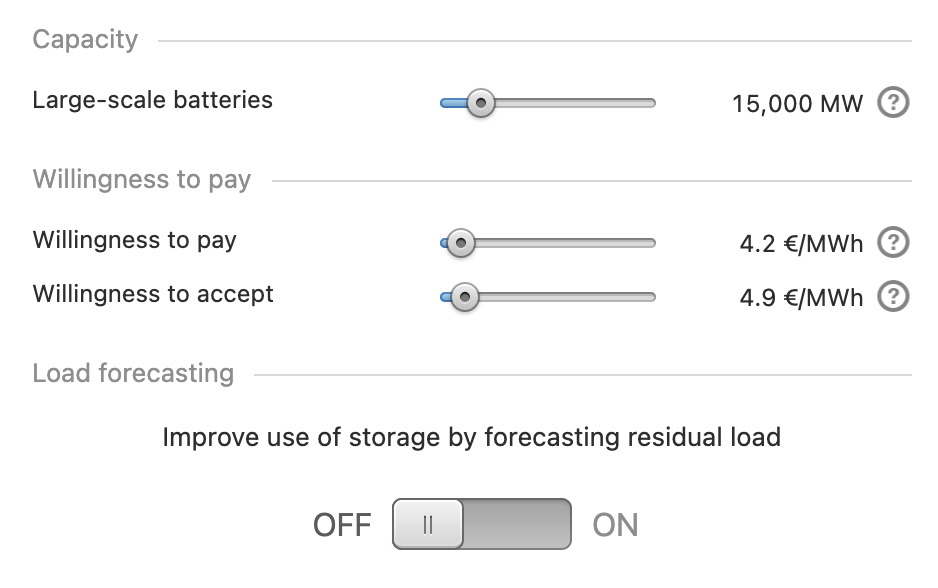
In the Flexibility → Electricity storage section, you can decide for each storage technology whether you want to enable a forecasting algorithm to determine its behaviour.
The technologies for which this forecasting algorithm algorithm is enabled, will consecutively try to flatten the electricity residual load curve. You can now set the order in which these technologies are applied yourself. Go to the Flexibility → Electricity storage → Merit order section to see how.
For more information, go to our documentation.
January 2023
Single sign-on
The Energy Transition Model has a new system for signing in. Aside from a new look to the login and account pages, the ETM should work much as it always has.
The new system allows us to associate your scenarios with your account, ensuring that only you can make changes to them. As before, they will default to being public, allowing other visitors to view and copy your scenarios, but not edit them. If you prefer to keep your scenarios private, you can change the privacy setting in your account settings. Private scenarios can only be viewed by their owner: you.
Alternatively, it is possible to change the privacy setting of individual saved scenarios. To do this, head to your saved scenarios page, click on the scenario you’d like to change, and then on the “Public/Private” dropdown on the right side of the page.
API
Users of our API can also benefit from the added security provided by authentication by using personal access tokens. You can now list all of your scenarios, delete scenarios, as well as work with saved scenarios and transition paths.
A detailed list of changes is available on our documentation website.
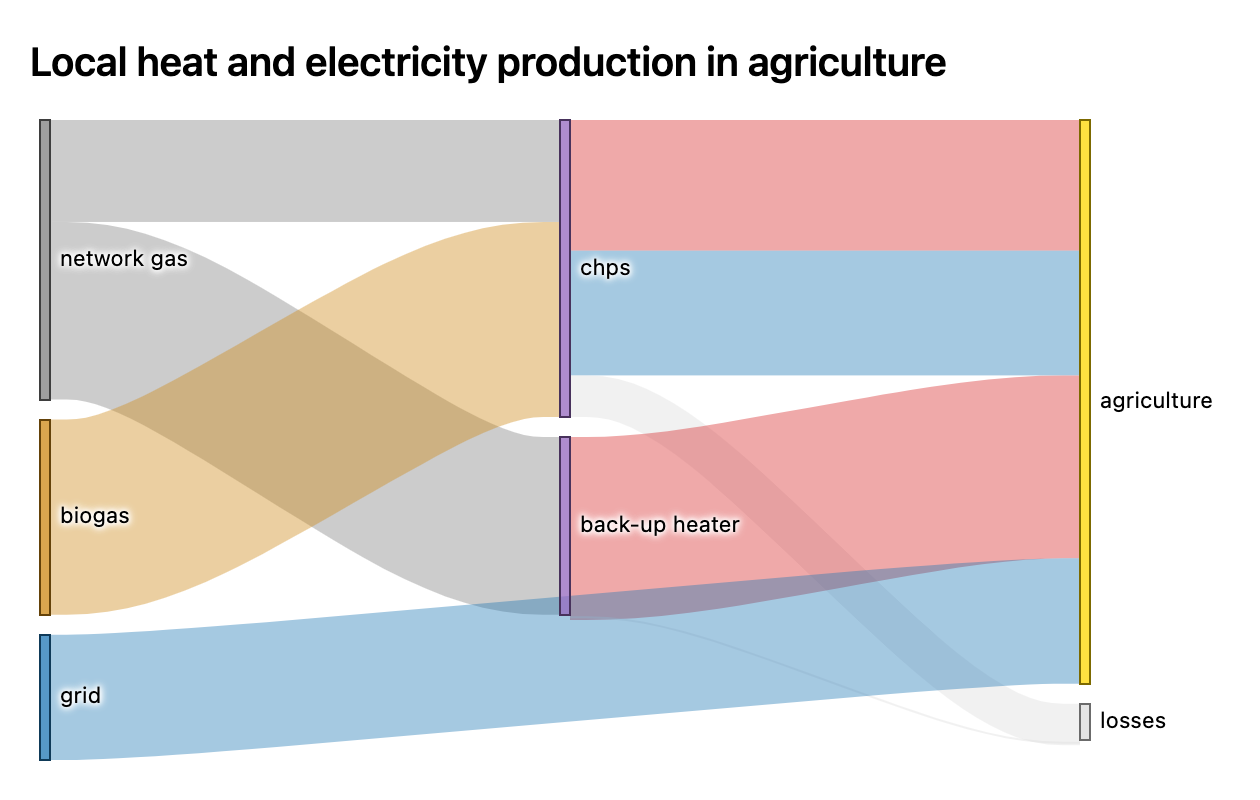
CHPs for local agriculture heat demand
It is now possible to install combined heat and power (CHP) units, that supply heat to meet local demand from agriculture. You can set the share of heat demand that is supplied by these local CHPs in the Demand → Agriculture → Heat section. The capacities of different types of CHPs can then be set in the Demand → Agriculture → Heat from local CHPs section.
Two charts have been added, one that shows you the total local heat supply and demand per year. The other chart (see below) also shows you the electricity flows that are produced by the CHPs.
Electricity storage in electric buses, vans and trucks
As the number of electric vehicles increases, it is becoming increasingly interesting to utilize the batteries that are present in those vehicles during hours when they are not used for transportation. It was already possible to use batteries in electric cars to provide storage services to the electricity grid, and now this is also possible for electric buses, vans and trucks.
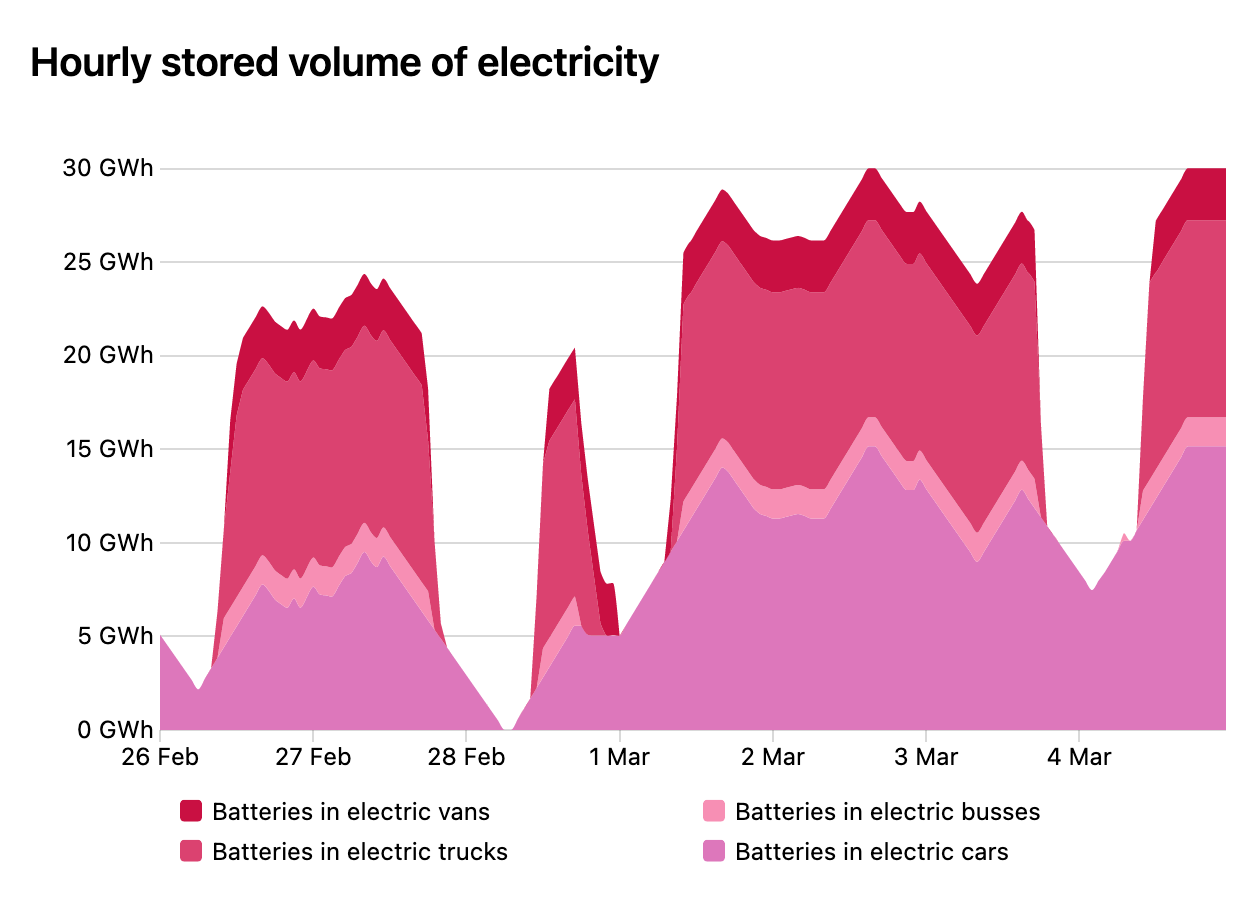
Go to the Flexibility → Electricity storage → Batteries in electric vehicles section, to see how you can put these batteries to use. The total available battery storage volume does depend on the number of electric vehicles in your scenario, which you can determine in the Demand → Transport section.
Chart sets
In the ‘See more charts’ pop-up, you can now choose to load multiple charts at once. With a single click on ‘System overview’ you will open a predetermined selection of charts and tables that provide you a full overview of your energy system.

If you would like to add another set of charts, please contact Quintel.
December 2022
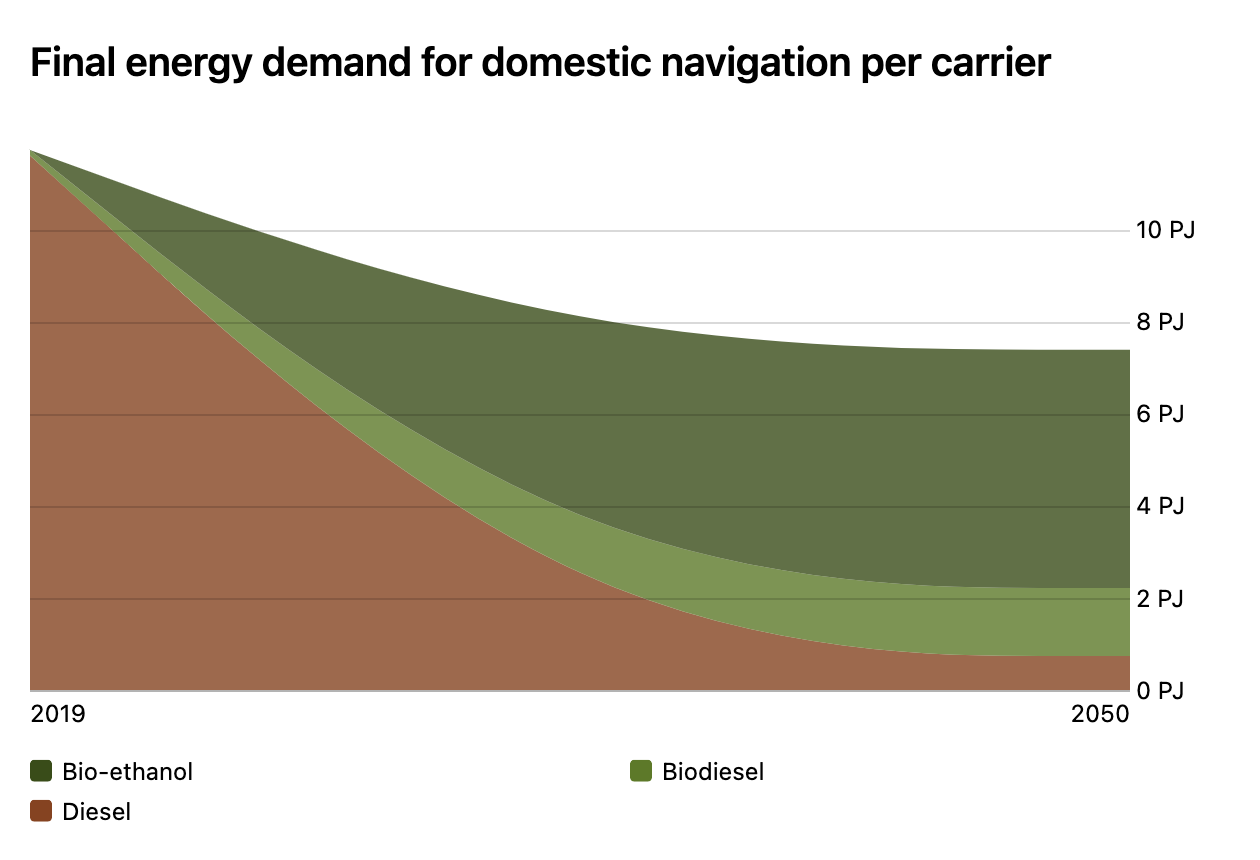
Bio-ethanol for inland shipping
Currently, ships for inland waterway transport are often fitted with conventional diesel engines. Advanced multifuel diesel engines are being developed that can run on a range of fuels, including bio-ethanol. You can set the share of diesel engines in Demand → Transport → Freight transport. You can then add bio-ethanol by changing the fuel mix of these engines in Supply → Transport fuels → Domestic navigation.
Hydrogen use in the industrial heating network
Two new technologies have been added that can supply steam to the industrial heat network. You can now install capacity for a hydrogen turbine CHP, which produces both steam and electricity, and for a hydrogen heater, which only produces steam. Go to Demand → Industry → Steam network sources to check it out.
November 2022
First Asian country is now available: Singapore
A few weeks ago Singapore has been added to the ETM as the first city-state and the first Asian country. This also means it is now easier to add countries outside of the EU to the ETM. Select Singapore as a region when starting a new scenario to start exploring its energy system!
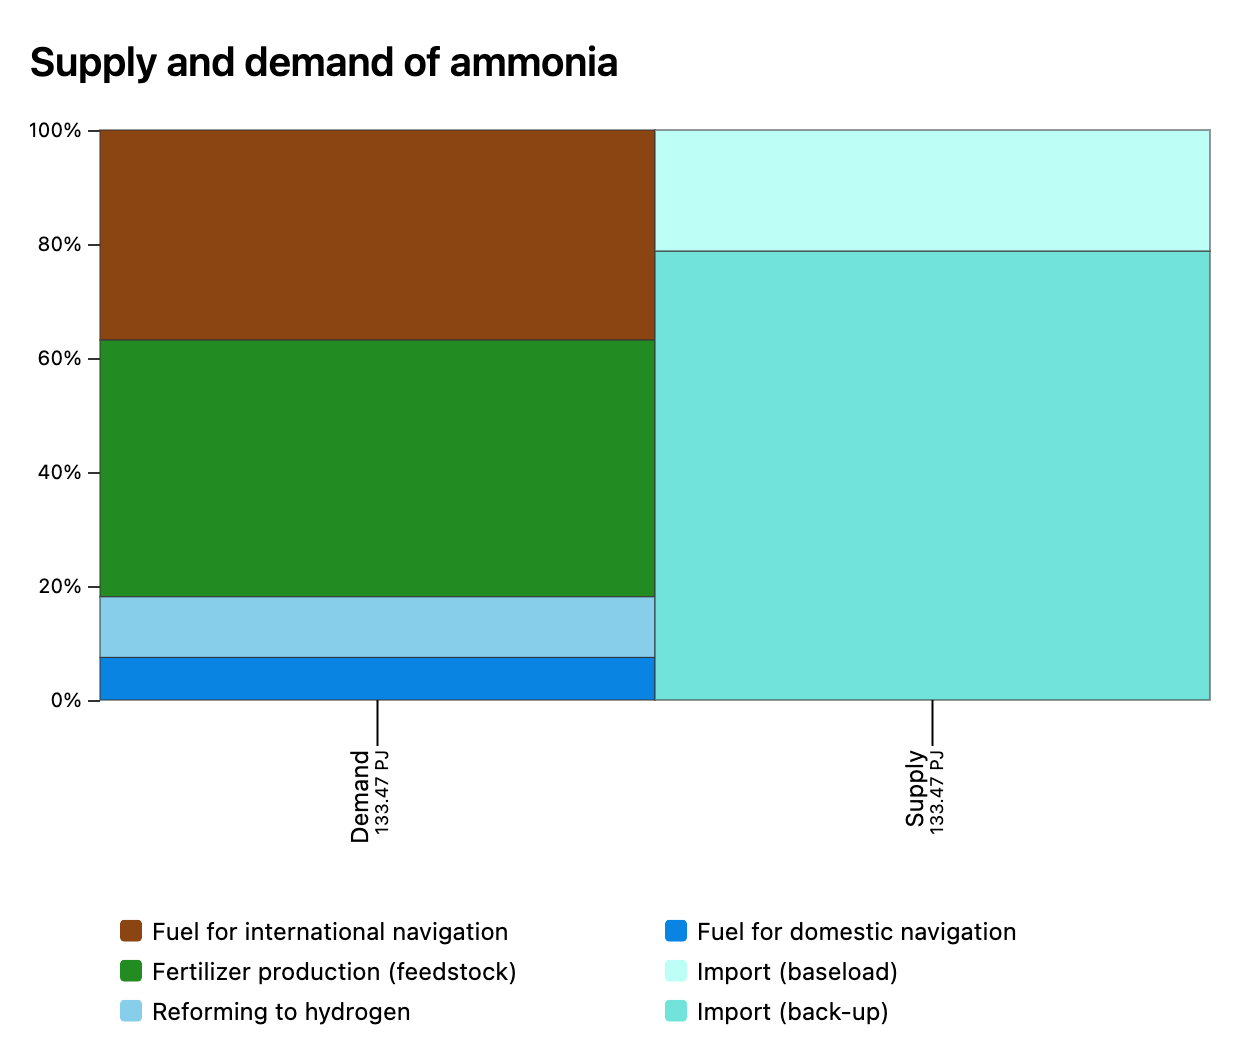
Addition of ammonia
Shipping of liquified green ammonia (and then reforming it to hydrogen) is seen as a more practical option for importing large amounts of green hydrogen than transporting the hydrogen directly. The possibility to import ammonia and convert it to hydrogen using a reformer has therefore been added to the model.
In addition to that, it is possible to use ammonia directly in the fertilizer industry, or as a transport fuel in domestic or international navigation.
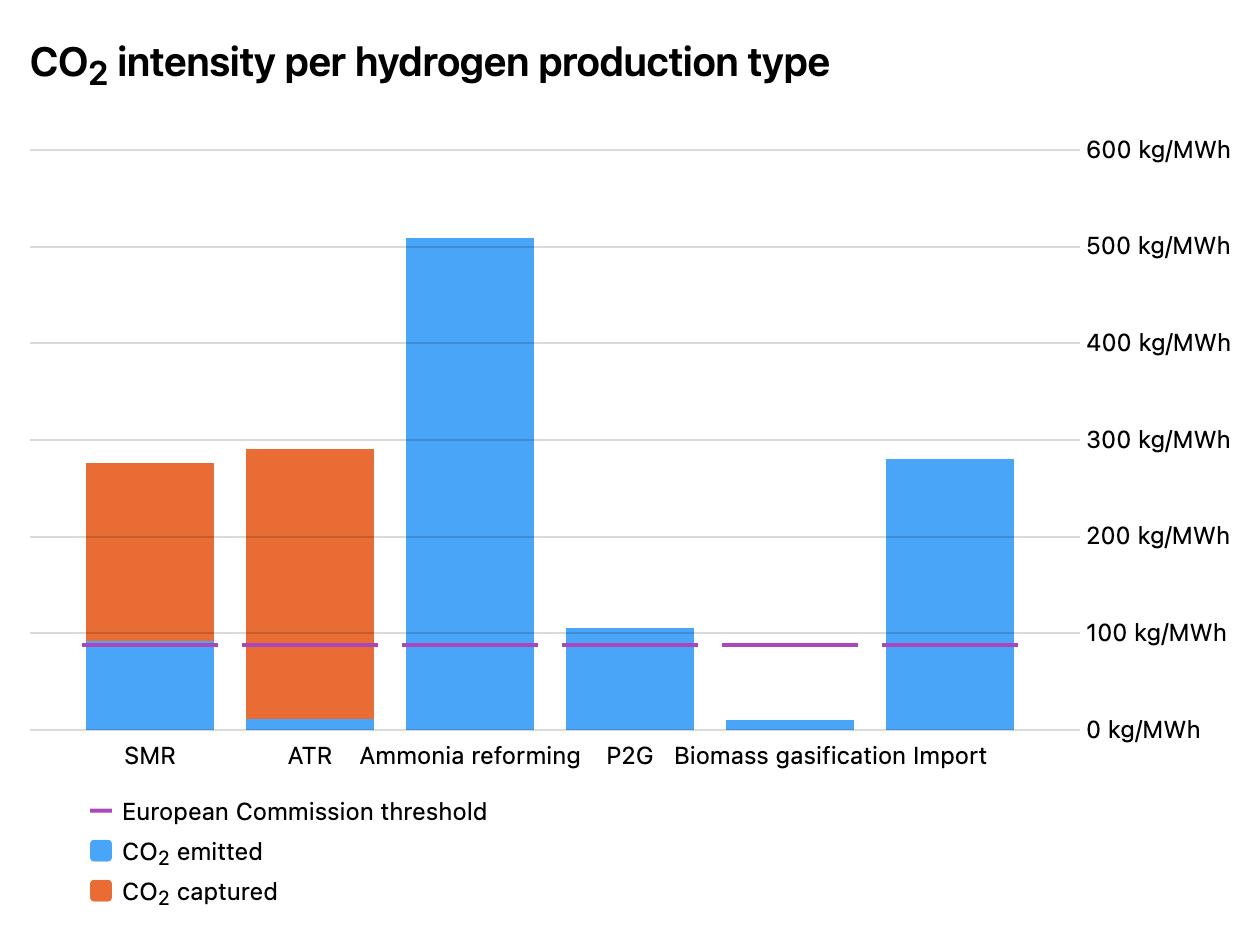
Addition of Autothermal reforming
A new hydrogen production technology has been added to the model: Autothermal reforming (ATR). This is a proven technology that uses natural gas to produce hydrogen. You can set its installed capacity in Supply → Hydrogen → Hydrogen production.
The main benefit of ATR compared to the common hydrogen production technology Steam methane reforming (SMR), is that it allows for the capture of a higher share of CO2 emissions. You can add carbon capture for the ATR in Emissions → CCUS → Capture of CO2.
New CO2 intensity of hydrogen chart
A new chart that allows you to compare the CO2 intensity of different hydrogen production routes have been added to the model. You can select the chart from the chart selection or go to Supply → Hydrogen → CO2 emissions of imported hydrogen.
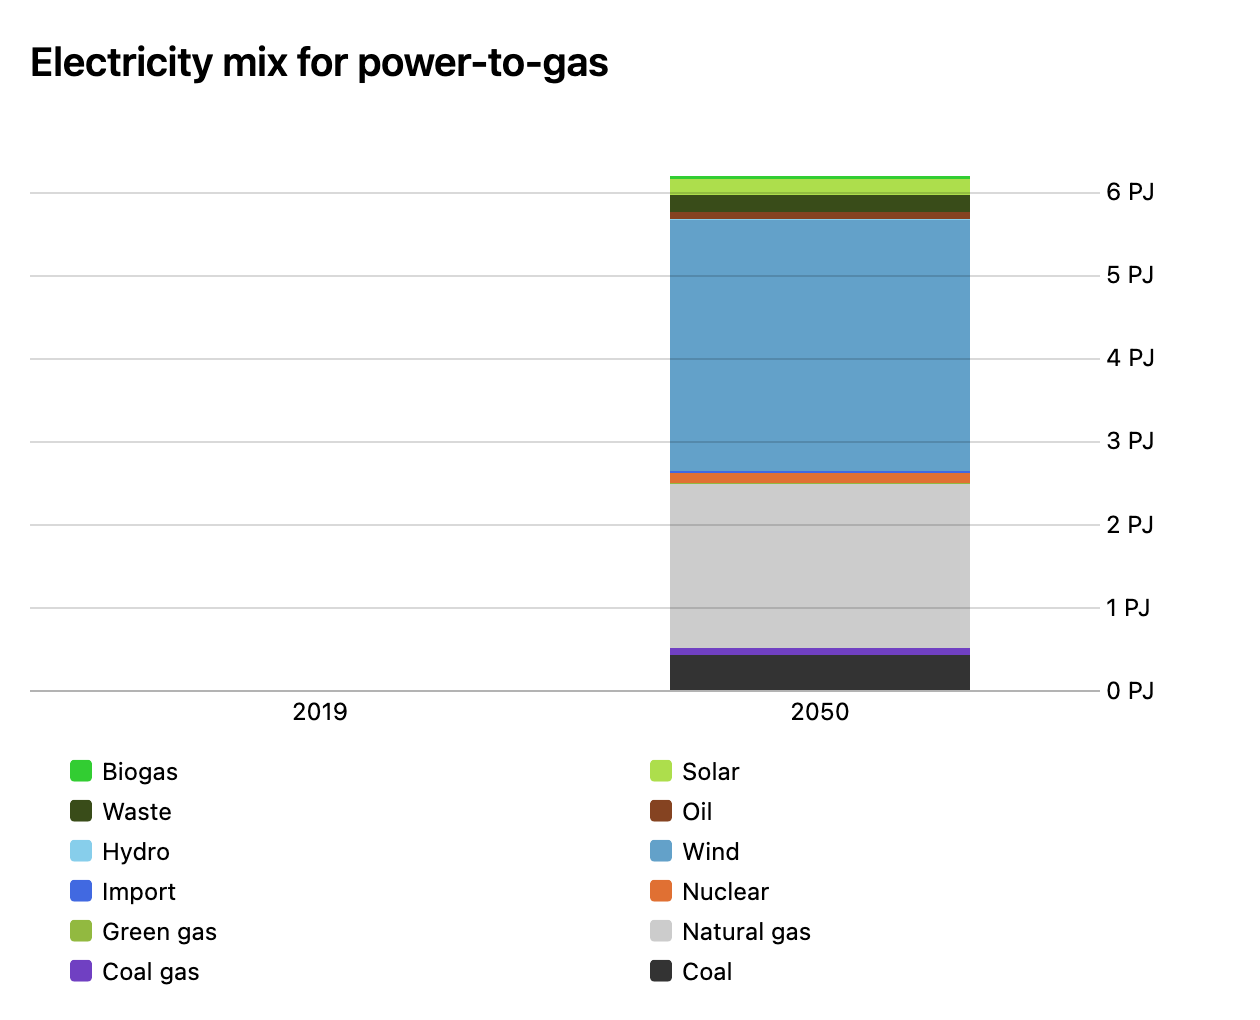
New electricity mix for power-to-gas chart
Another useful chart has been added. This chart shows you the electricity mix used to produce hydrogen through electrolysis, also known as power-to-gas. You can select the chart from the chart selection or go to Flexibility → Electricity conversion → Conversion to hydrogen.
Analysis of the need for flexibility
For the gaseous carriers hydrogen and network gas, hourly balancing of supply and demand is performed by storage. There are however technical and economical limitations to the extent to which storage volume can be realized in an area. This is especially relevant when different types of large-scale underground storage are required. Some storage may be required to handle short-term variations in supply and demand, while additional storage volume may be necessary to deal with long-term seasonal variations.
A new section and table have been added that can help you assess the different storage needs. You can find them in Flexibility → Overview → The need for flexibility: timescales.
October 2022
New transport technologies for ships and planes
For domestic navigation, also known as inland shipping, it is now possible to switch to electric ships. You can determine the share of electric ships in the total transportation by domestic navigation in Demand → Transport → Freight transport → Domestic navigation technology.
For domestic aviation technology, or more simply put, plane transport, two new technologies have been added to the model. In addition to kerosene, gasoline and bio-ethanol, you can switch to either electricity or hydrogen. Go to Demand → Transport → Passenger transport → Domestic aviation technology to check it out.
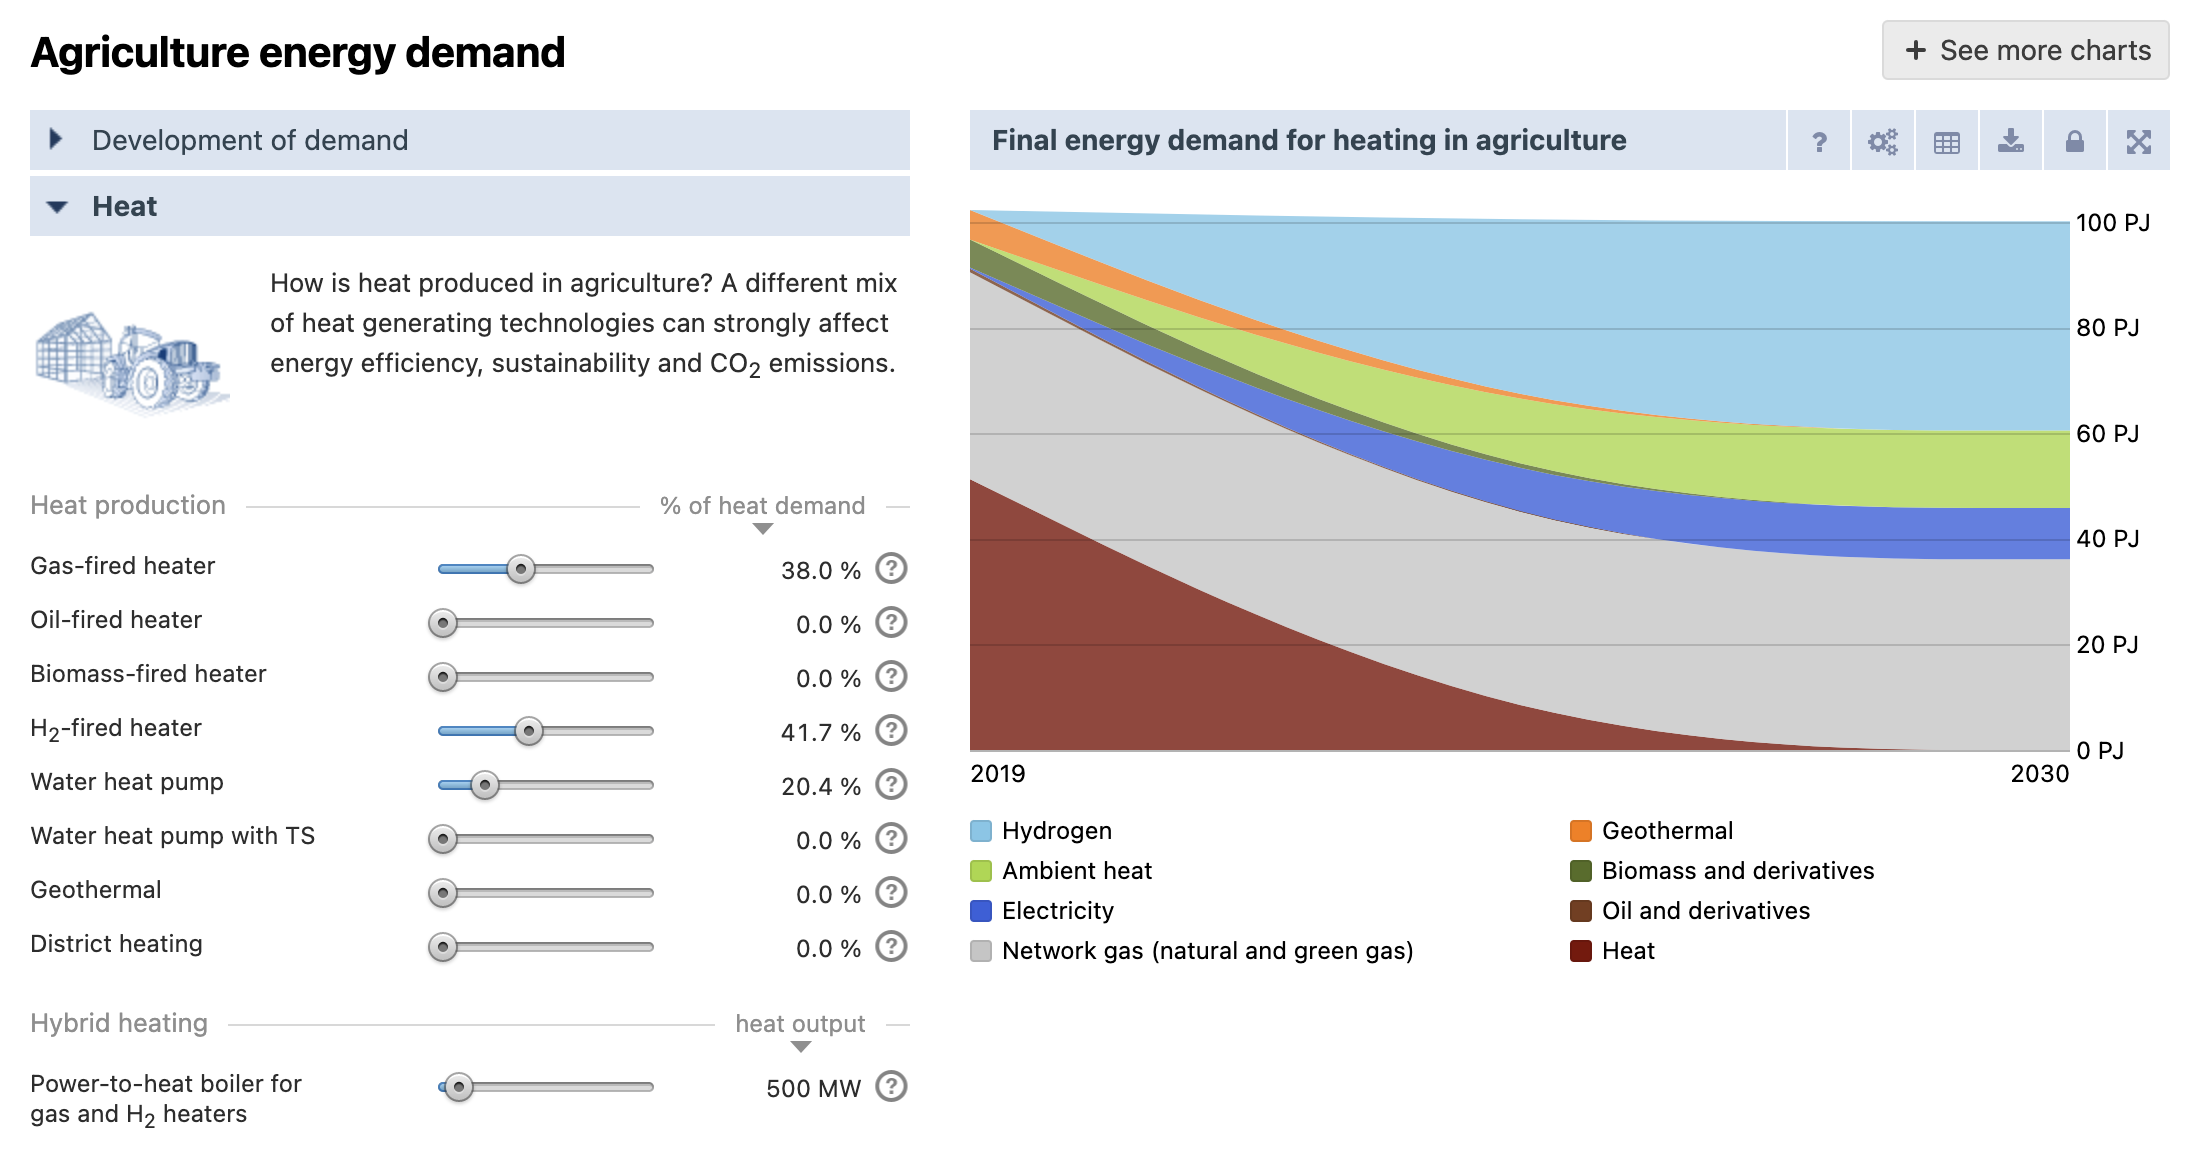
New heating technologies in agriculture
In the agriculture sector, you can now choose to install a water heat pump. This is an electric water-water heat pump that uses a water reservoir as its heat source. Only a small amount of electricity is then still required to bring the water to the desired temparature, making it much more efficient than a simple electric boiler. You can find the heat pump in Demand → Agriculture → Heat.
In the same section, you can now also install power-to-heat capacity for agriculture. This is an electric boiler that is fitted to existing natural gas or hydrogen heaters, making them hybrid heaters. The hybrid heater uses electricity when the electricity price is below the maximum willingness to pay. If the electricity price exceeds the willingness to pay, the heater switches to its original fuel source (either gas or hydrogen). You can set this willingness to pay in Flexibility → Electricity conversion → Conversion to heat for agriculture.
September 2022
Update of the transition path charts tool
The transition path charts tool has had a significant update. With this tool you can open one of your scenarios and explore what happens between the start and end year. You can easily make changes to the slider settings for various intermediate years and thereby shape the transition path towards the future.
The update includes an improved interface, various new charts that now allow you to toggle between area and bar charts, a table view underneath the charts and the possibility to easily export data as CSV files. Check out the updated tool here!
![]()
Addition of small modular nuclear reactors
A new type of nuclear power plants has been added to the model: small modular reactors. This novel technology is now available next to the existing large reactor 2nd and 3rd generation nuclear power plants. Go to Supply → Electricity → Nuclear plants to add them to your scenario.
Load shifting in the central ICT sector
Load shifting is a form of demand side response where electricity consumers can choose to delay their electricity demand. In hours where the electricity price is deemed too high, these consumers will reduce their demand. When the price drops again, they will then compensate for the accumulated deficit by increasing their demand.
This form of demand side response was already available for the metal, chemical, and other industry. It is now also available for the central ICT sector, which covers data centers, telecom, and other information and communication services. You can add load shifting for the central ICT under Flexibility → Net load → Demand response - load shifting in industry.
July 2022
Hydrogen-powered ships
Hydrogen-powered ships are now available as a technology in the transport sector. Hydrogen can be used as a fuel for inland shipping, also known as domestic navigation. Go to the Demand → Transport → Freight transport section to check it out. It can also be used as a fuel for maritime shipping, or international navigation, which you can set at the Demand → Transport → International transport section.
Hybrid hydrogen heatpump for buildings
In addition to a hybrid heatpump that uses gas, it is now also possible to heat the buildings in your scenario with a hybrid heatpump that uses hydrogen. You can find this new heating technology in the Demand → Buildings → Space heating section.
April 2022
Additions and improvements for EU countries
With the inclusion of Cyprus, Estonia and Malta, all countries of the EU are now included in the ETM! You can check out these countries by selecting one of them in the region dropdown when starting a new scenario.
The base year data for these countries origins mainly from the Eurostat Energy Balances 2019 and JRC Potencia tool. For a complete overview of all data that is used, have a look at ETM Dataset Manager. The final energy demand for these EU countries was matched as much as possible to the Eurostat Energy Balances. The supply side (heat and electricity production) is more complex and has some room for improvement. Feel free to contact us with suggestions using the Contact form.
Freight transport by vans
Instead of being included in truck transport, vans are now shown in the model as a separate category of their own. This enables you to make different choices for developments in trucks and vans technologies and their use in the Demand → Transport → Freight transport section!
![]()
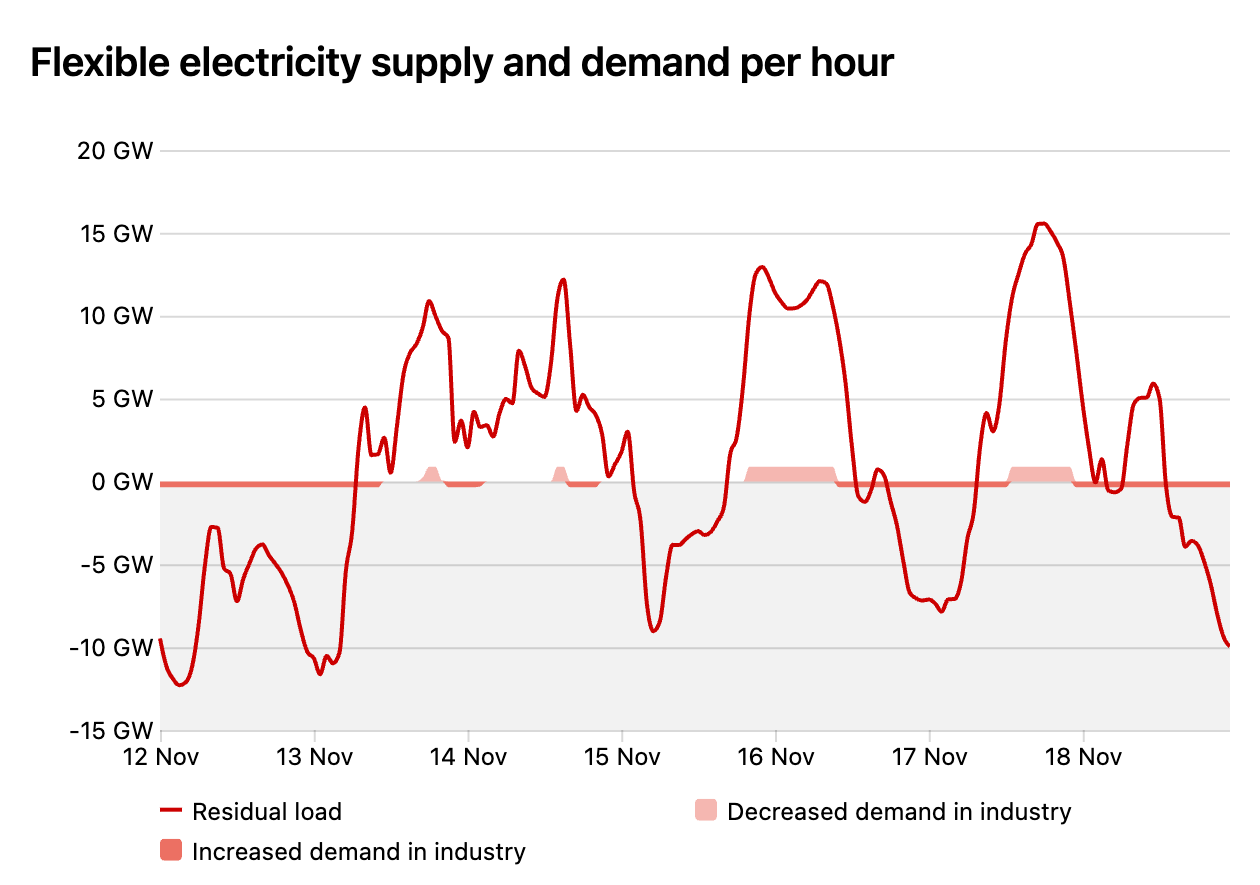
Explore Demand Side Response in industry
You can now explore the effects of Demand Side Response in the industry on sub sector level in the Flexibility section, under Net Load.
Capacity to shift the electricity demand can be installed for the metal, chemical, and other industry. In hours when the electricity price is too high, the sector will then be able to decrease its demand. The shortage that accumulates during those hours is caught up at a later time, when the electricity price is lower, thereby saving costs for industry.
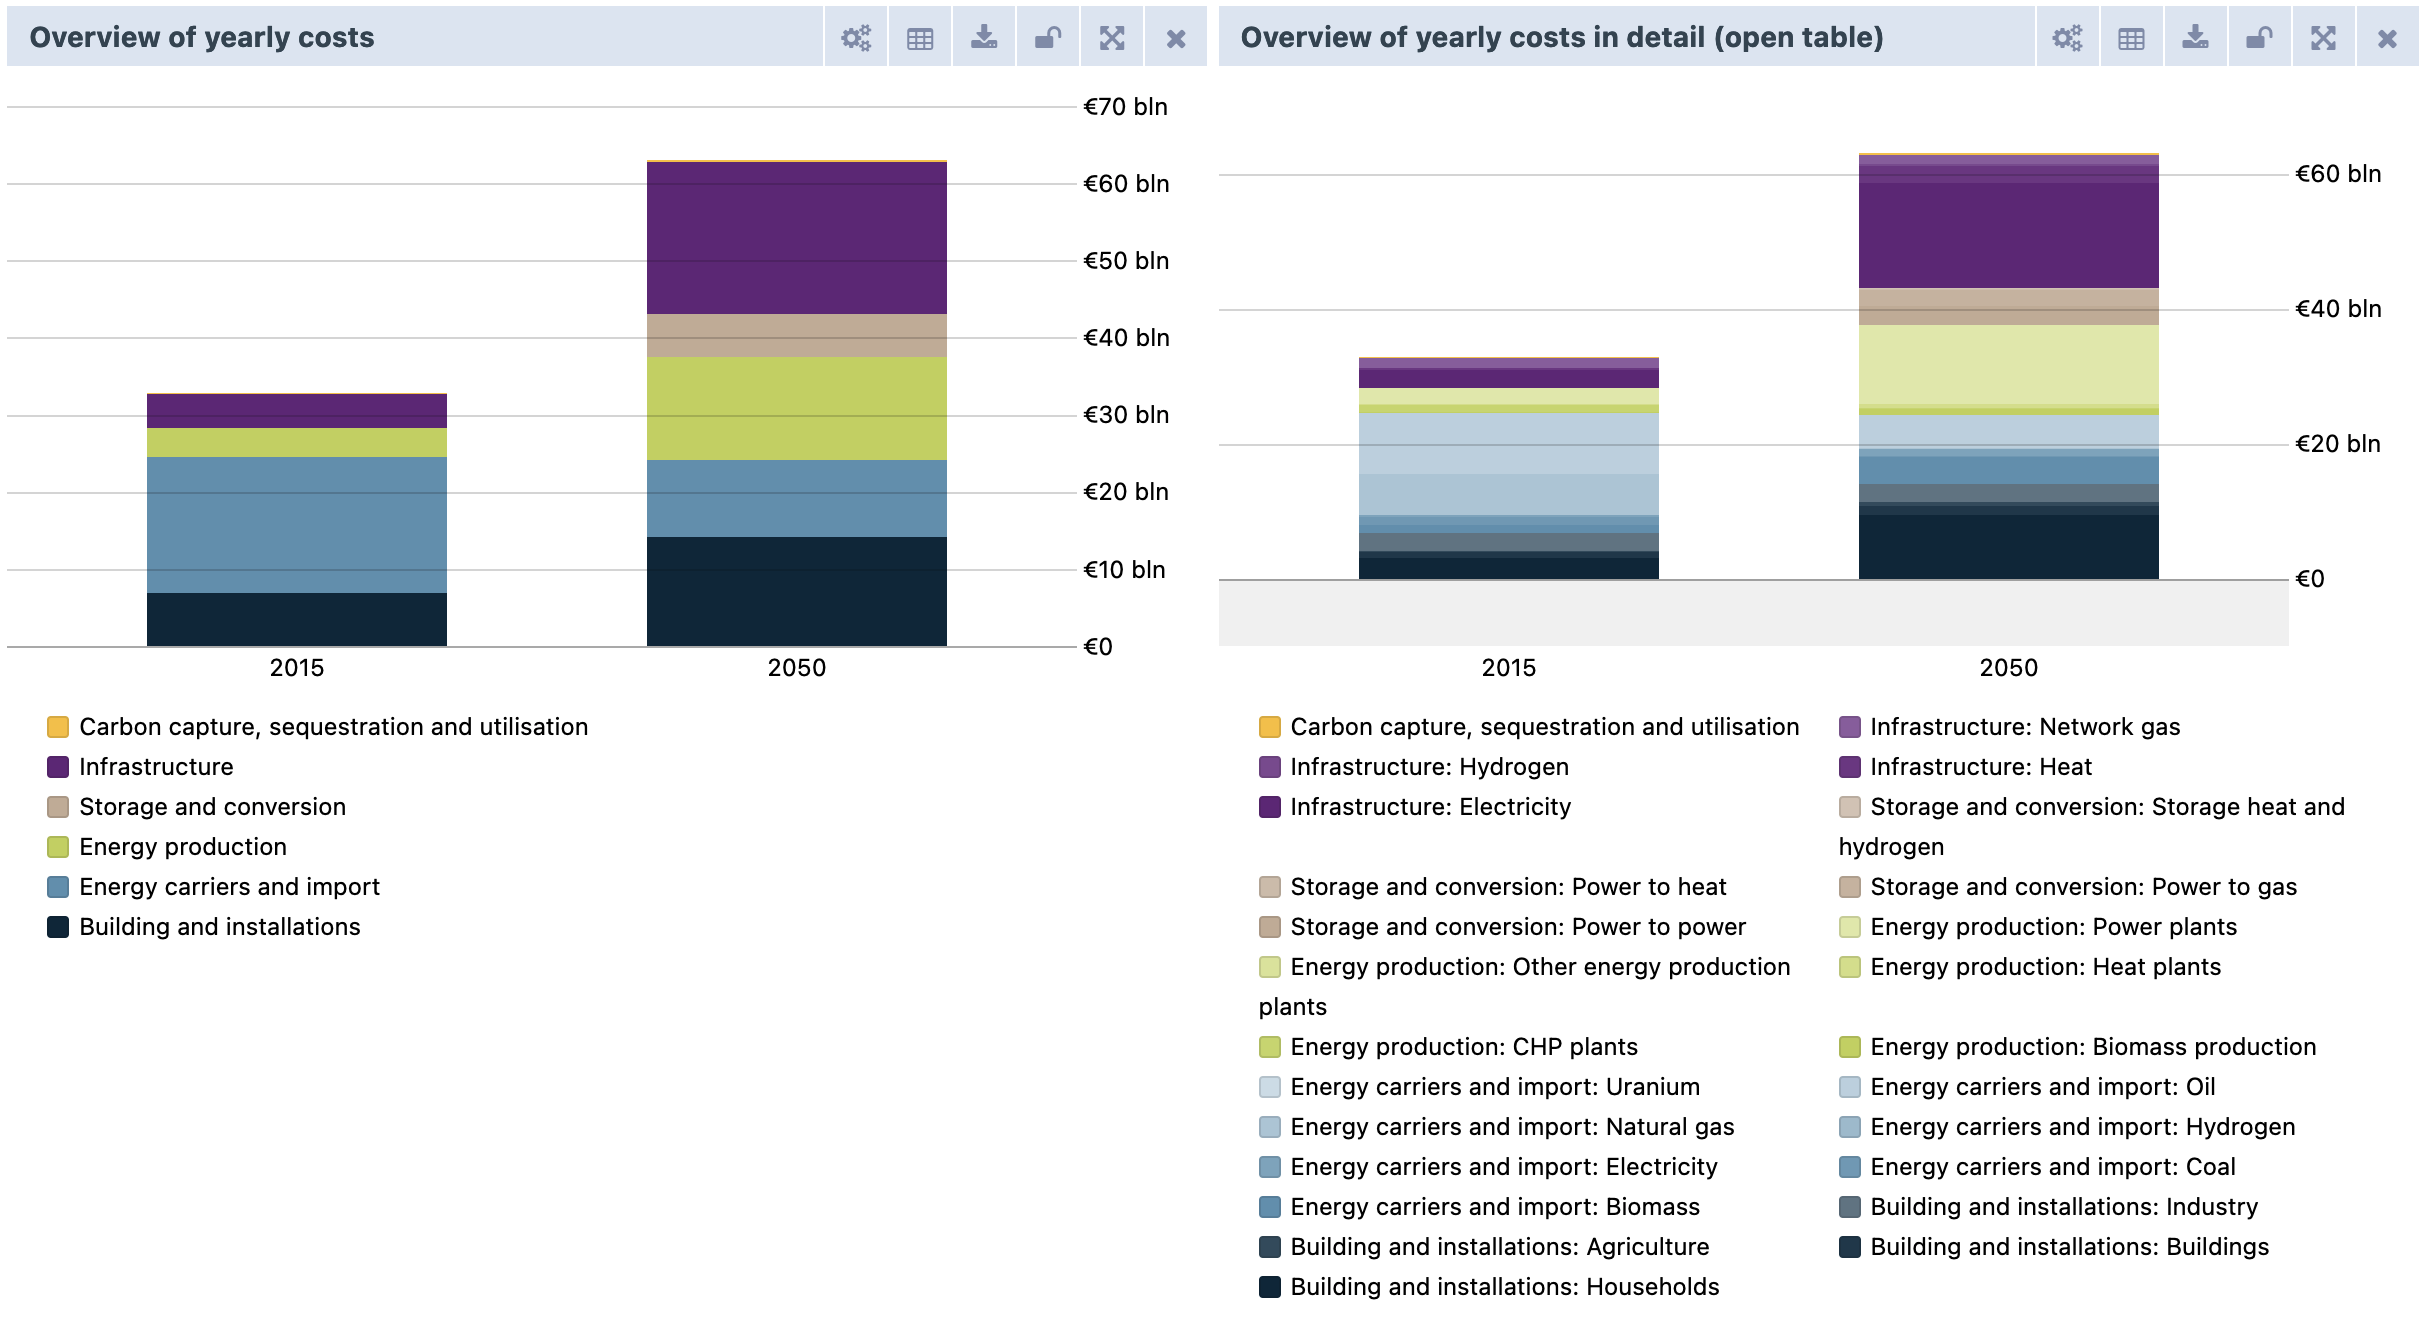
Costs: update of charts and data export
The ETM contains new cost charts with clear catogories. The method of cost calculation has also been updated. The ETM now explicitly calculates CAPEX, OPEX and fuel costs. For all technologies these can be exported in the data export section of the ETM. For more details about cost calculations see the documentation.
January 2022
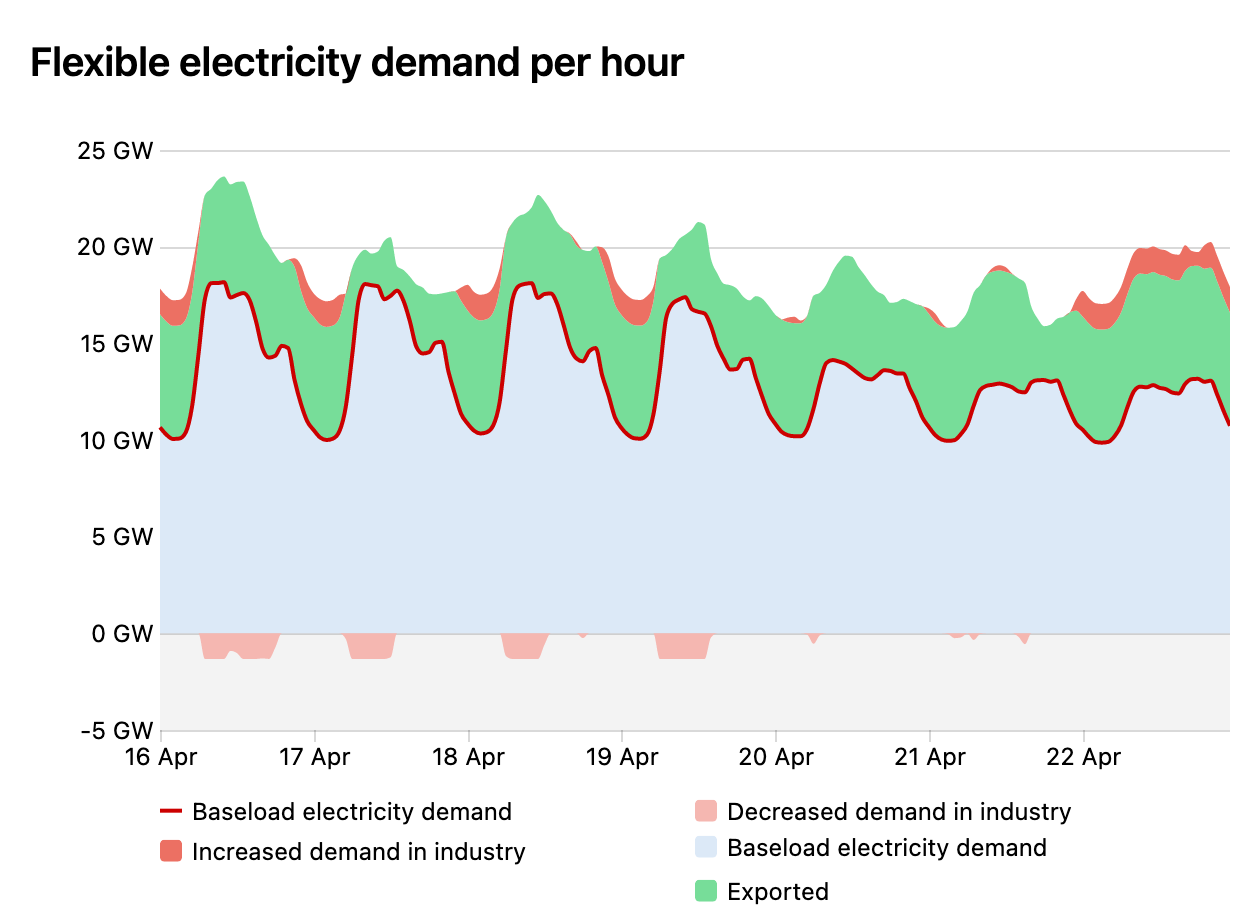
Explore price-sensitive electricity demand
Previously, the use of flexible electricity demand technologies could be determined by manually setting the order in which these technologies could use electricity. This has now been replaced by price-sensitive behaviour. This means that for power-to-gas, power-to-heat and electricity storage a willingness to pay has to be set. For export, the willingness to pay is given by the prices of the interconnectors.
The behaviour for all of these technologies can be set in the Flexibility section, for Storage, Conversion and Export. New charts that can help you set the behaviour can also be found there. For storage, in addition to the willingness to pay, a willingness to accept has to be set. Alternatively, instead of the price-sensitive behaviour, a forecasting algorithm can be used to determine storage behaviour.
If it is profitable, power plants will now supply these flexible demand technologies. For example, depending on the prices, a nuclear power plant could be used to produce hydrogen through power-to-gas. This also means that power plants will produce for export when it is profitable.
Important: for scenarios that have been made before this update and in which the flexibility merit order was manually set, the willingness to pay of each technology is updated to replicate this set merit order. Please note that the impact of this model update can still be significant for existing scenarios, because the prices of the interconnectors have not been adjusted for export and import.
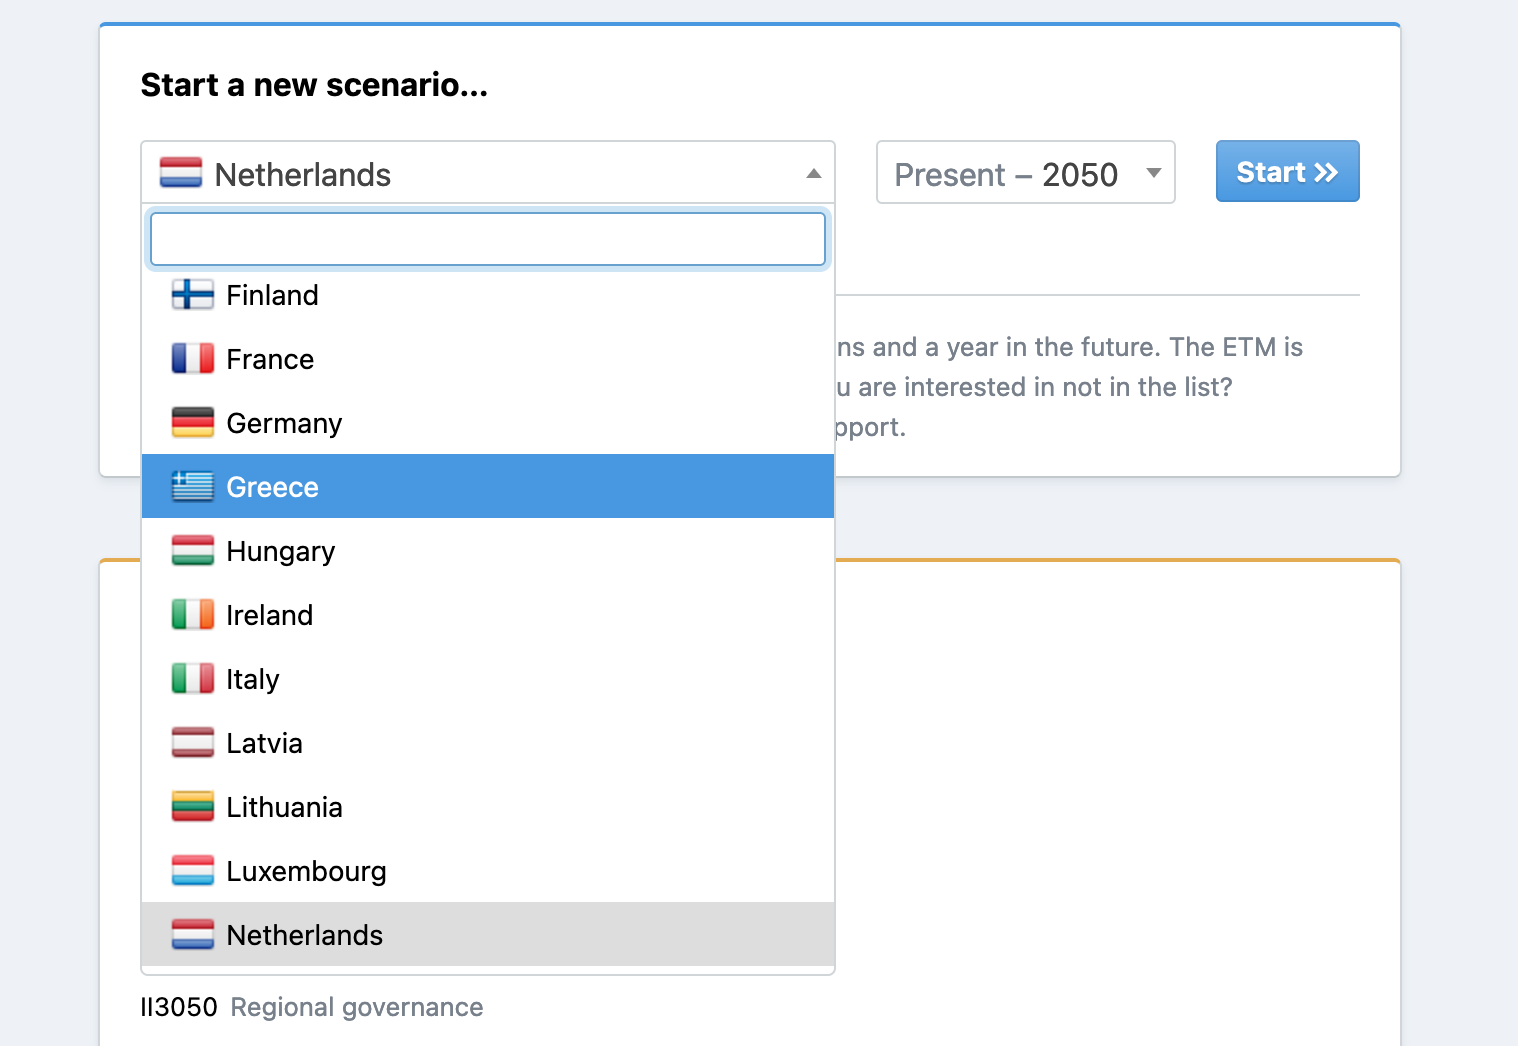
New EU countries can be selected for your scenarios
We are proud to share that most EU countries are now available in the ETM. The most recent data from 2019 was used to create the datasets. You can now discover the differences in energy production and consumption between France and Hungary or create a scenario for Germany.
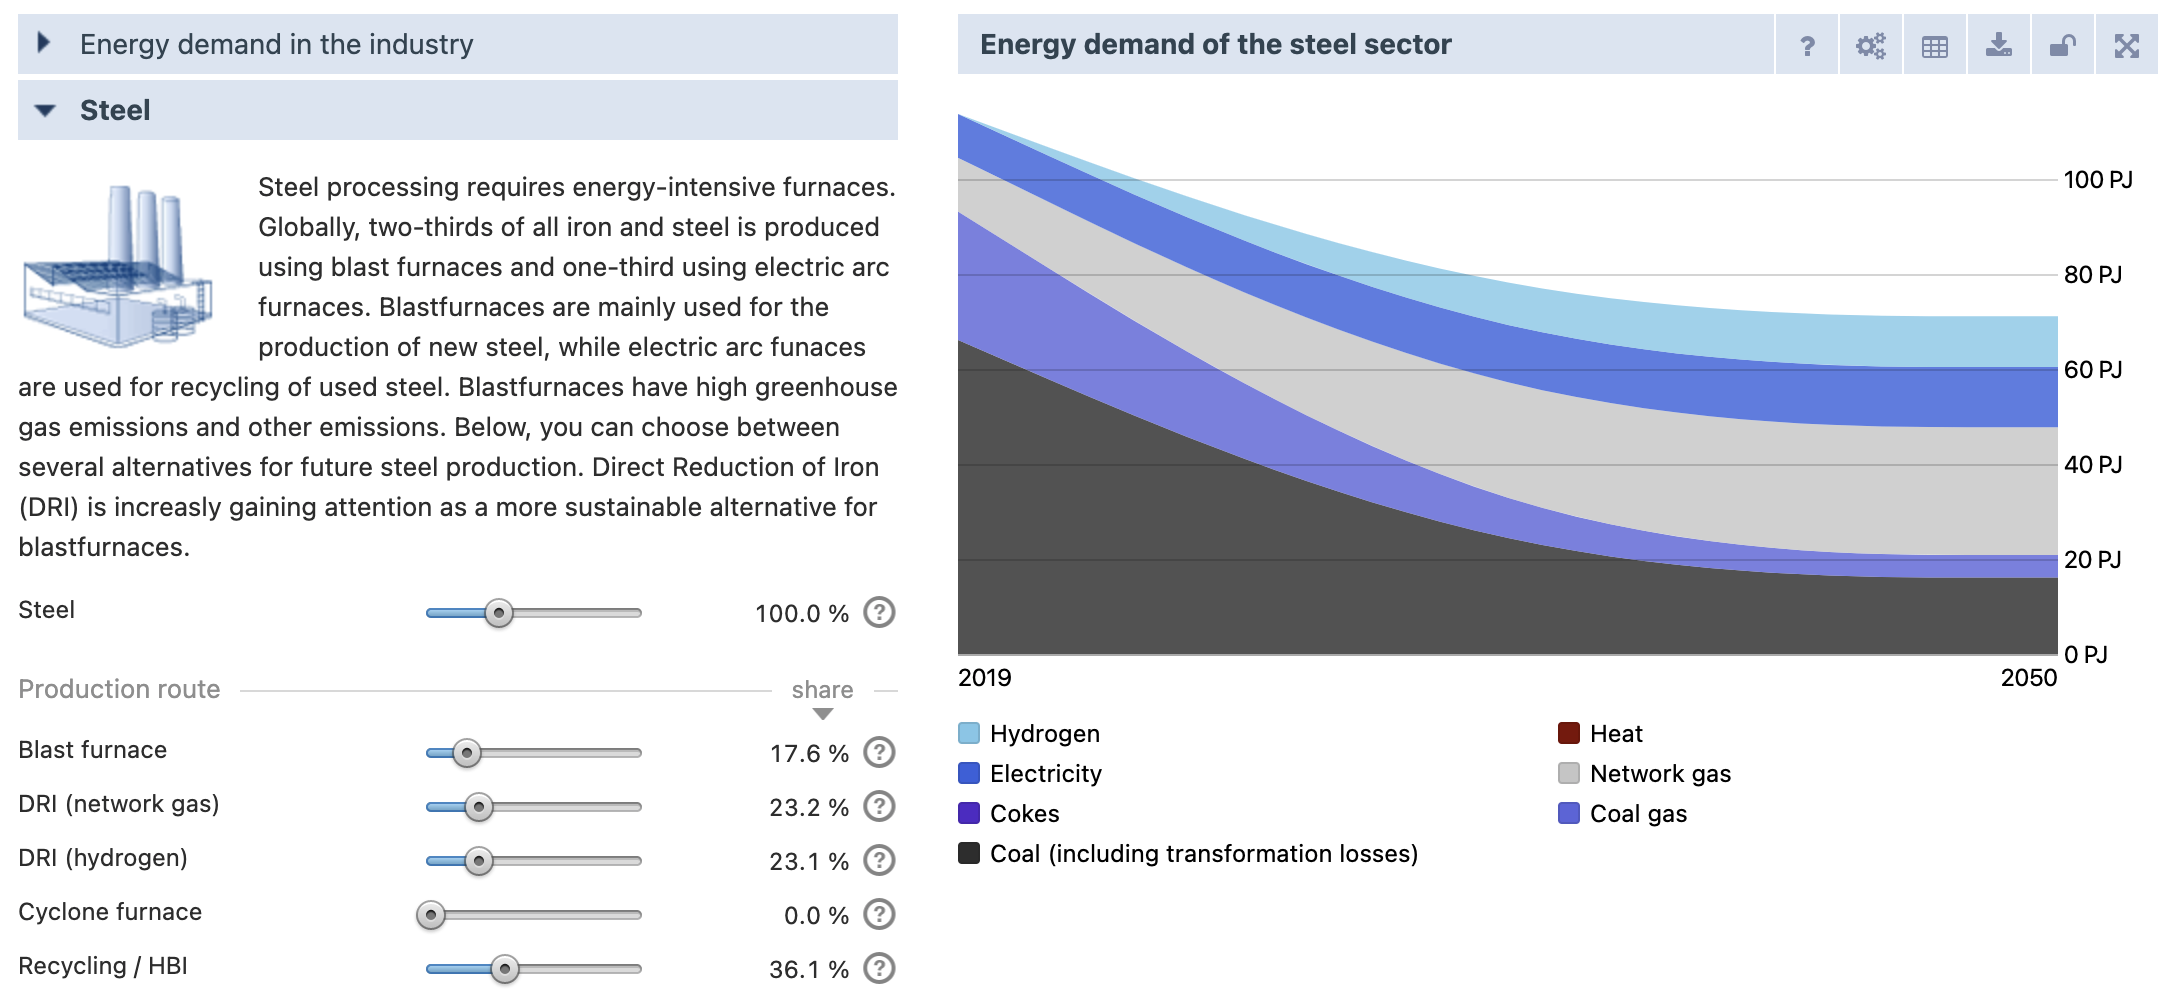
Choose from additional steel production technologies
The Energy Transition Model has been updated with the latest insights in steel industry production technologies. The model now includes the upcoming production technology Direct Reduction of Iron (DRI), where you can choose between hydrogen or natural gas, and improvements in the existing production technologies. These new production technologies can be found in Demand → Industry → Steel.
In addition, it is now possible to choose what coal gas in the steel sector will be used for using the new sliders in Emissions → CCUS → Coal gases from blast furnaces (steel). Coal gas can either be used for electricity production or for transformation into chemical feedstock.
Innovative flexible technologies
A number of innovative technologies have been added to the ETM and can now be explored. These technologies are all aimed at improving the flexibility of the electricity system.
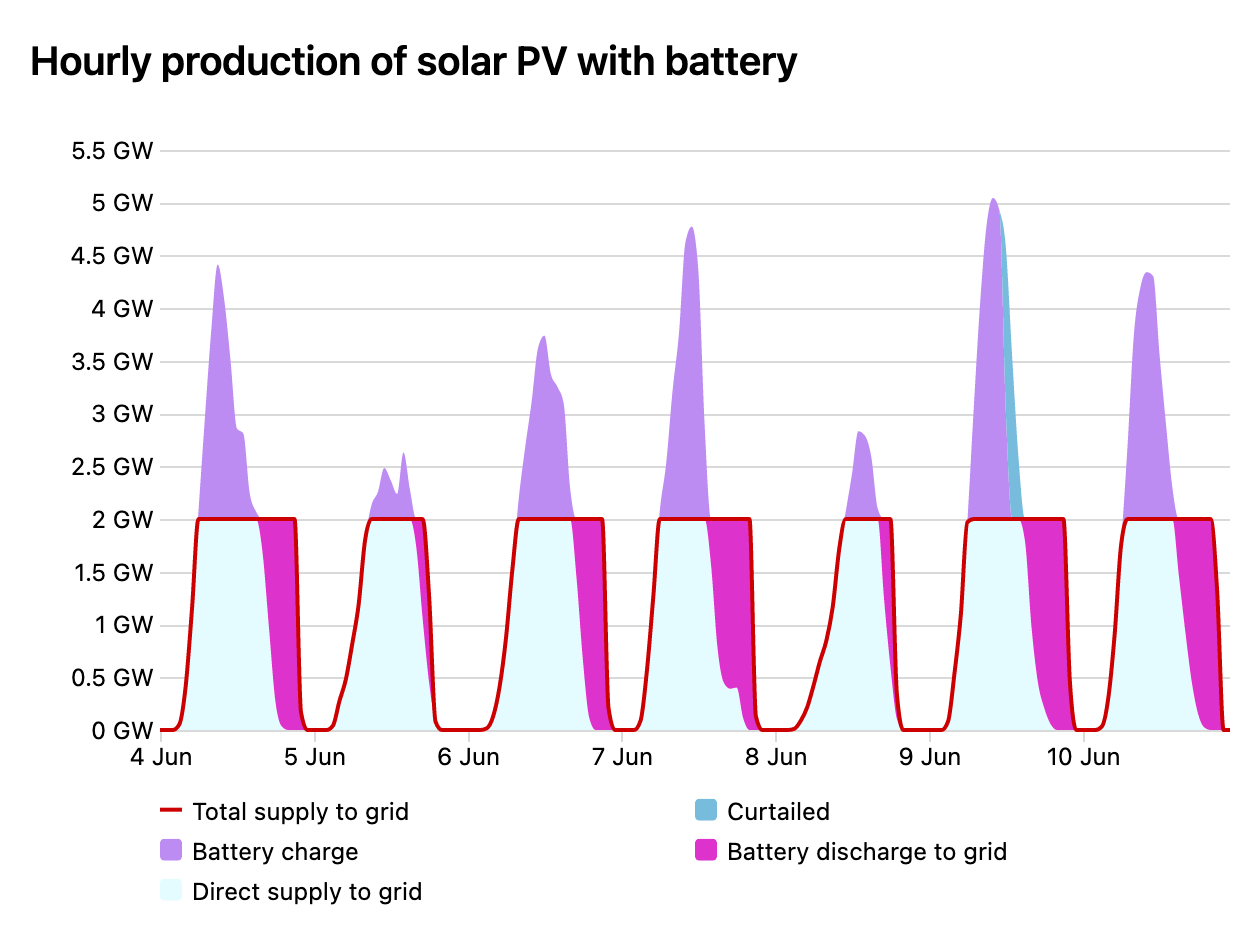
First, it is possible to install inland wind turbines or solar PV plants that have an integrated battery system. By changing the capacity of the battery and the grid connection you can change the profile that is supplied to the grid. In the Supply section you can install these Wind turbines and Solar plants.
Second, a new type of electricity storage is available: flow batteries. The innovative aspect of these batteries is that their volume can be scaled independently, and for relatively low costs compared to other batteries. These batteries can be found in Flexibility → Electricity storage → Flow batteries.
Third, offshore solar PV plants have been added to the model. These plants float in the sea, which increases the potential installation area for solar power in a country. They can be found in Supply → Renewable electricity → Solar power.
Finally, new heat pump systems are added. These heat pumps draw higher temperature heat from a special type of solar panels, PVT panels, making them more efficient than many other heat pumps. The panels simultaneously produce electricity. You can install these heat pumps with PVT panels in Demand → Households → Space heating & hot water.
October 2021
Start year 2019 new standard for scenarios for the Netherlands
The Energy Transition Model allows you to design your own energy system for a region of your choice, by making changes to its current energy system. For the Netherlands, we have now updated the start year representing the current energy system from 2015 to 2019. This means that when you open a new scenario for the Netherlands, you will see a representation of the energy system as it was in 2019, including the level of greenhouse gas emissions, the electricity production by energy source, the share of renewable energy etc.
Important: for scenarios that have been made before this update, with 2015 as a start year, nothing has changed. You can still access and edit any old scenario you saved under “My Scenarios”.
The basis of this dataset update is the open source energy balance from Eurostat, which is complemented by a number of other data sources, such as the CBS. All of the data sources we used to create the new dataset can be found in our documentation on Github. In addition, we have improved the process of updating our datasets, thereby increasing the quality of the new Dutch dataset and any future dataset updates.
September 2021
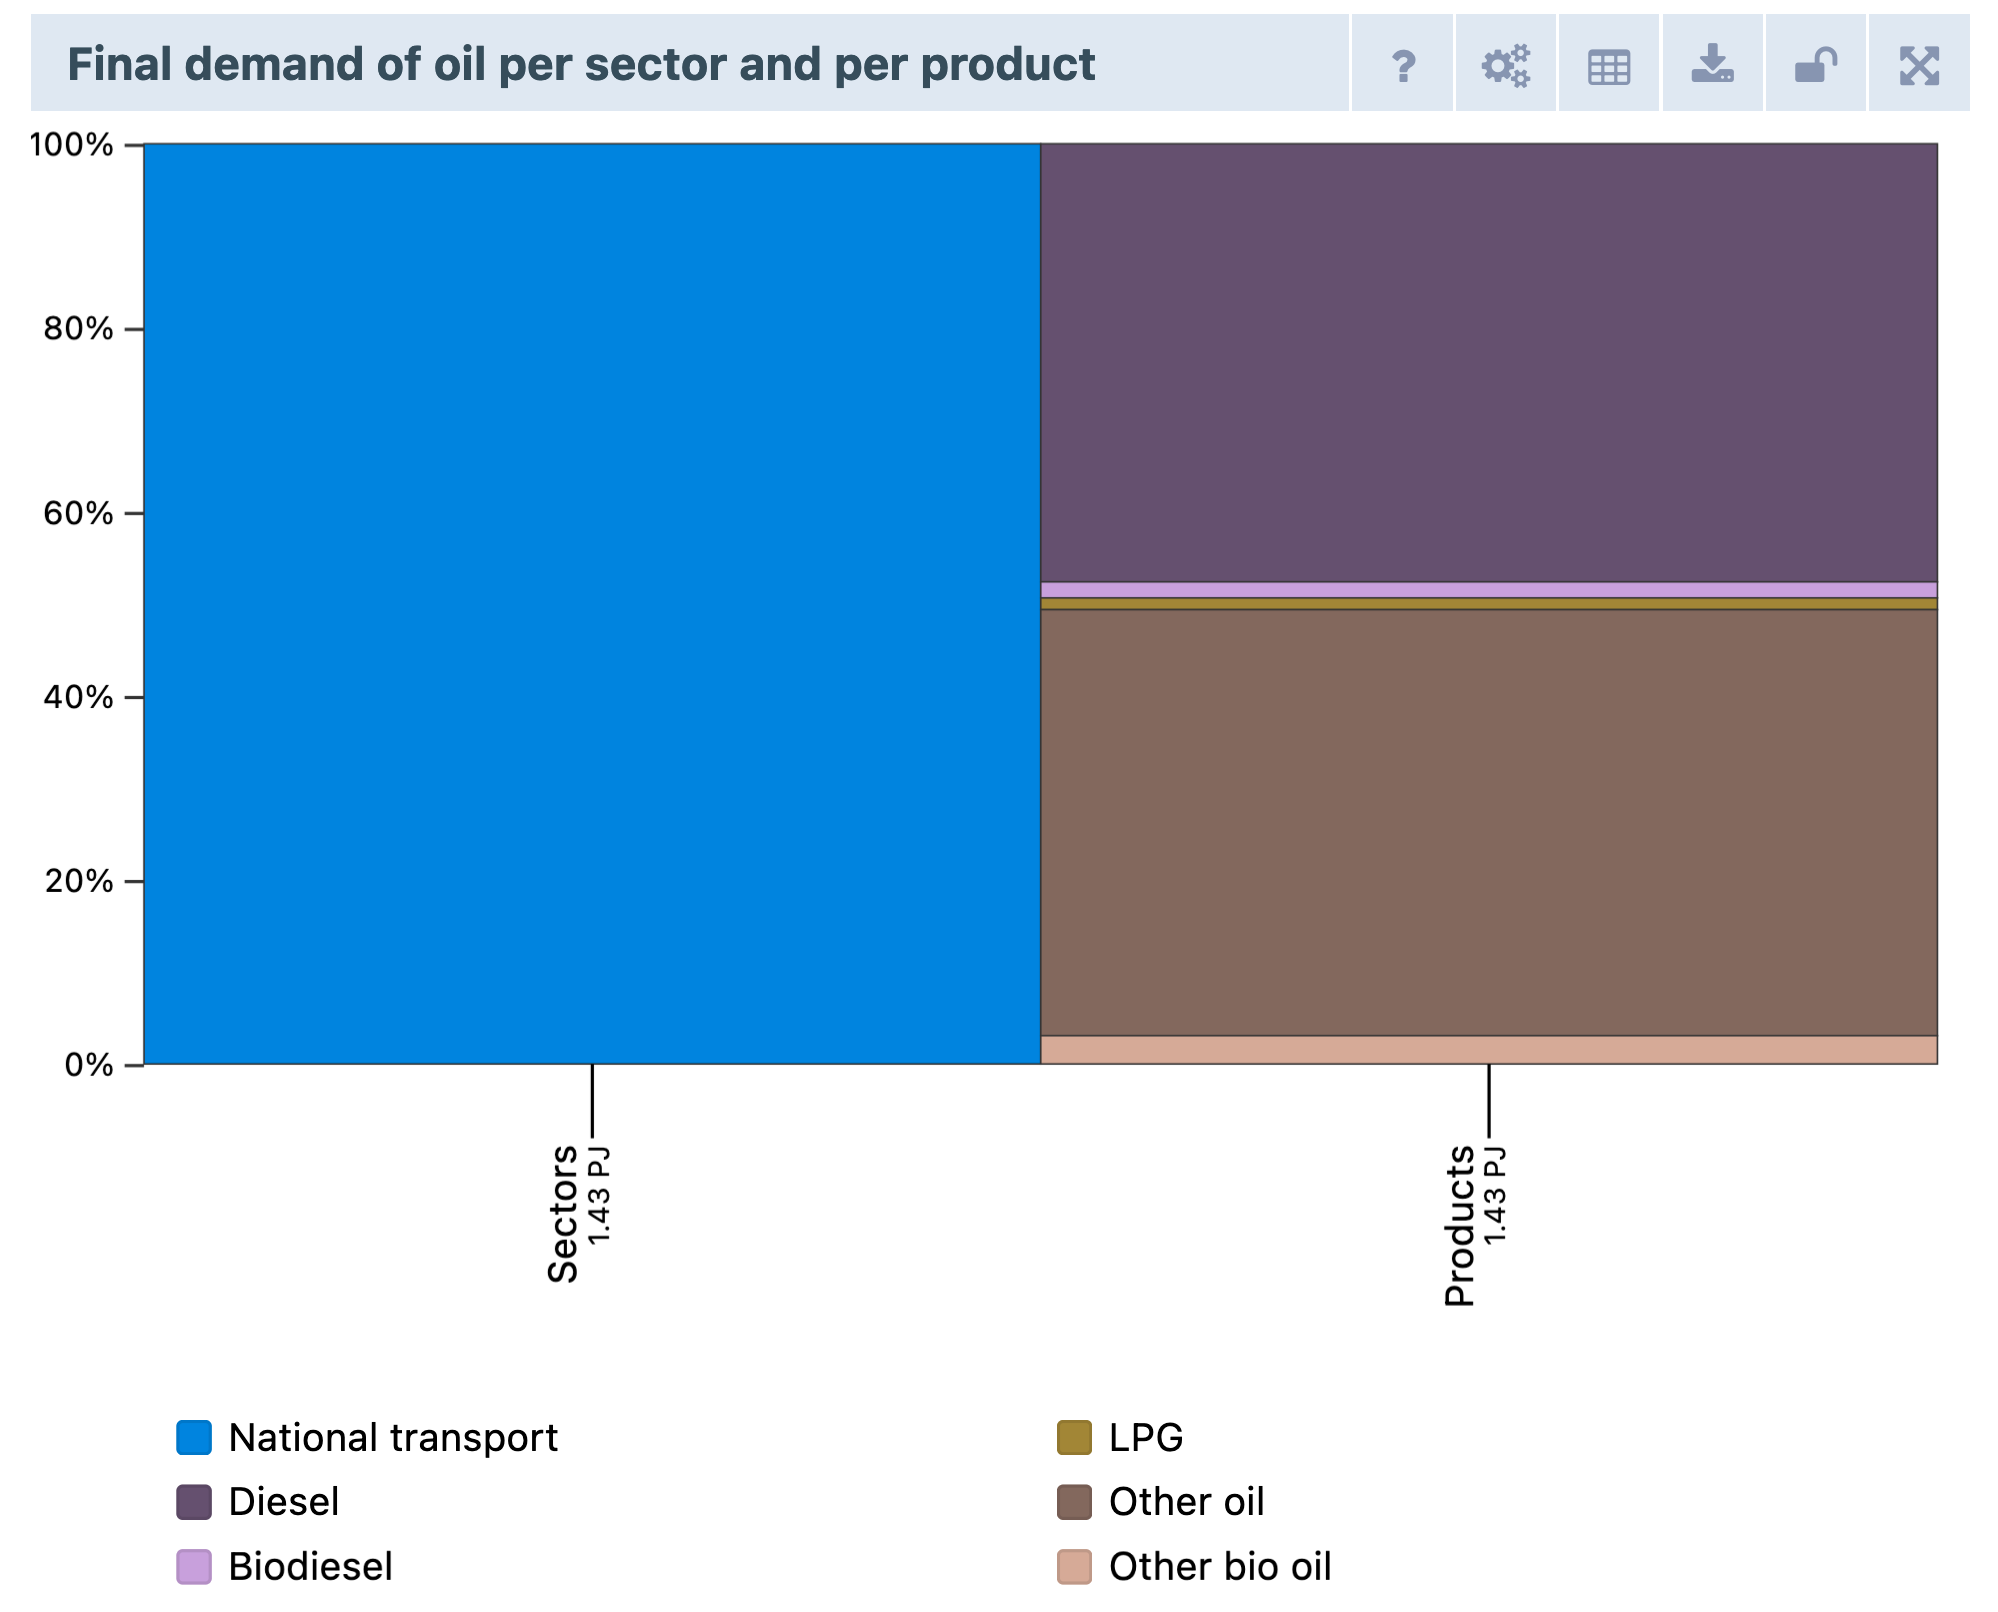
Determine the oil mix and add bio oil
It is now possible to determine the oil mix and add bio oils for households, buildings, industry and agriculture. You can do this under Supply → Biomass → Mix of oil and oil products.
Hydrogen trains
Hydrogen trains are seen as an opportunity to replace diesel trains. You can now add hydrogen trains to your scenario by using the new slider in Demand → Transport → Passenger transport → Train technology.
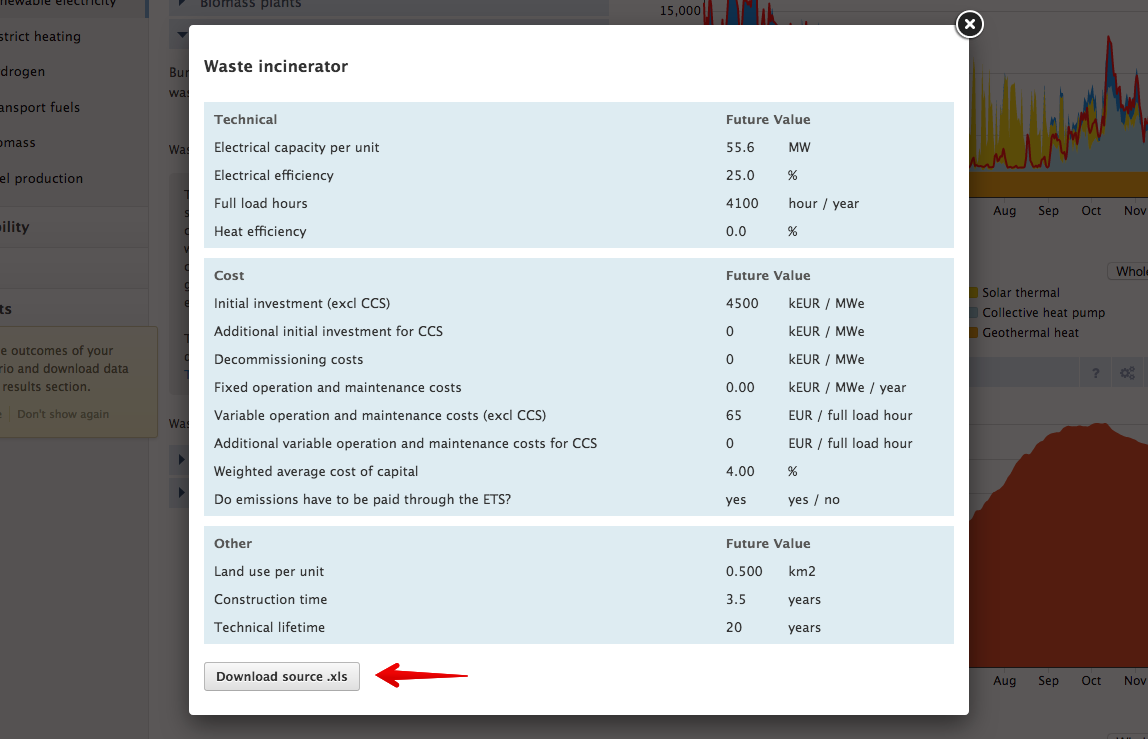
CCS Waste incinerators
Even though waste incinerators are seen as renewable energy producers, they still emit greenhouse gases. With Carbon Capture and Storage (CCS) it is possible to prevent the emission of greenhouse gases, making waste incineration more climate friendly. You can now add CCS to waste incinerators in Emissions → CCUS → Capture of CO2.
Air heat pump buildings
Air heat pumps in buildings are used as a method to provide heating or cooling. Previously it was not possible to incorporate air heat pumps within buildings but with the addition of a heat pump slider in Demand → Buildings → Space heating & Cooling you can add them to your scenario.
August 2021
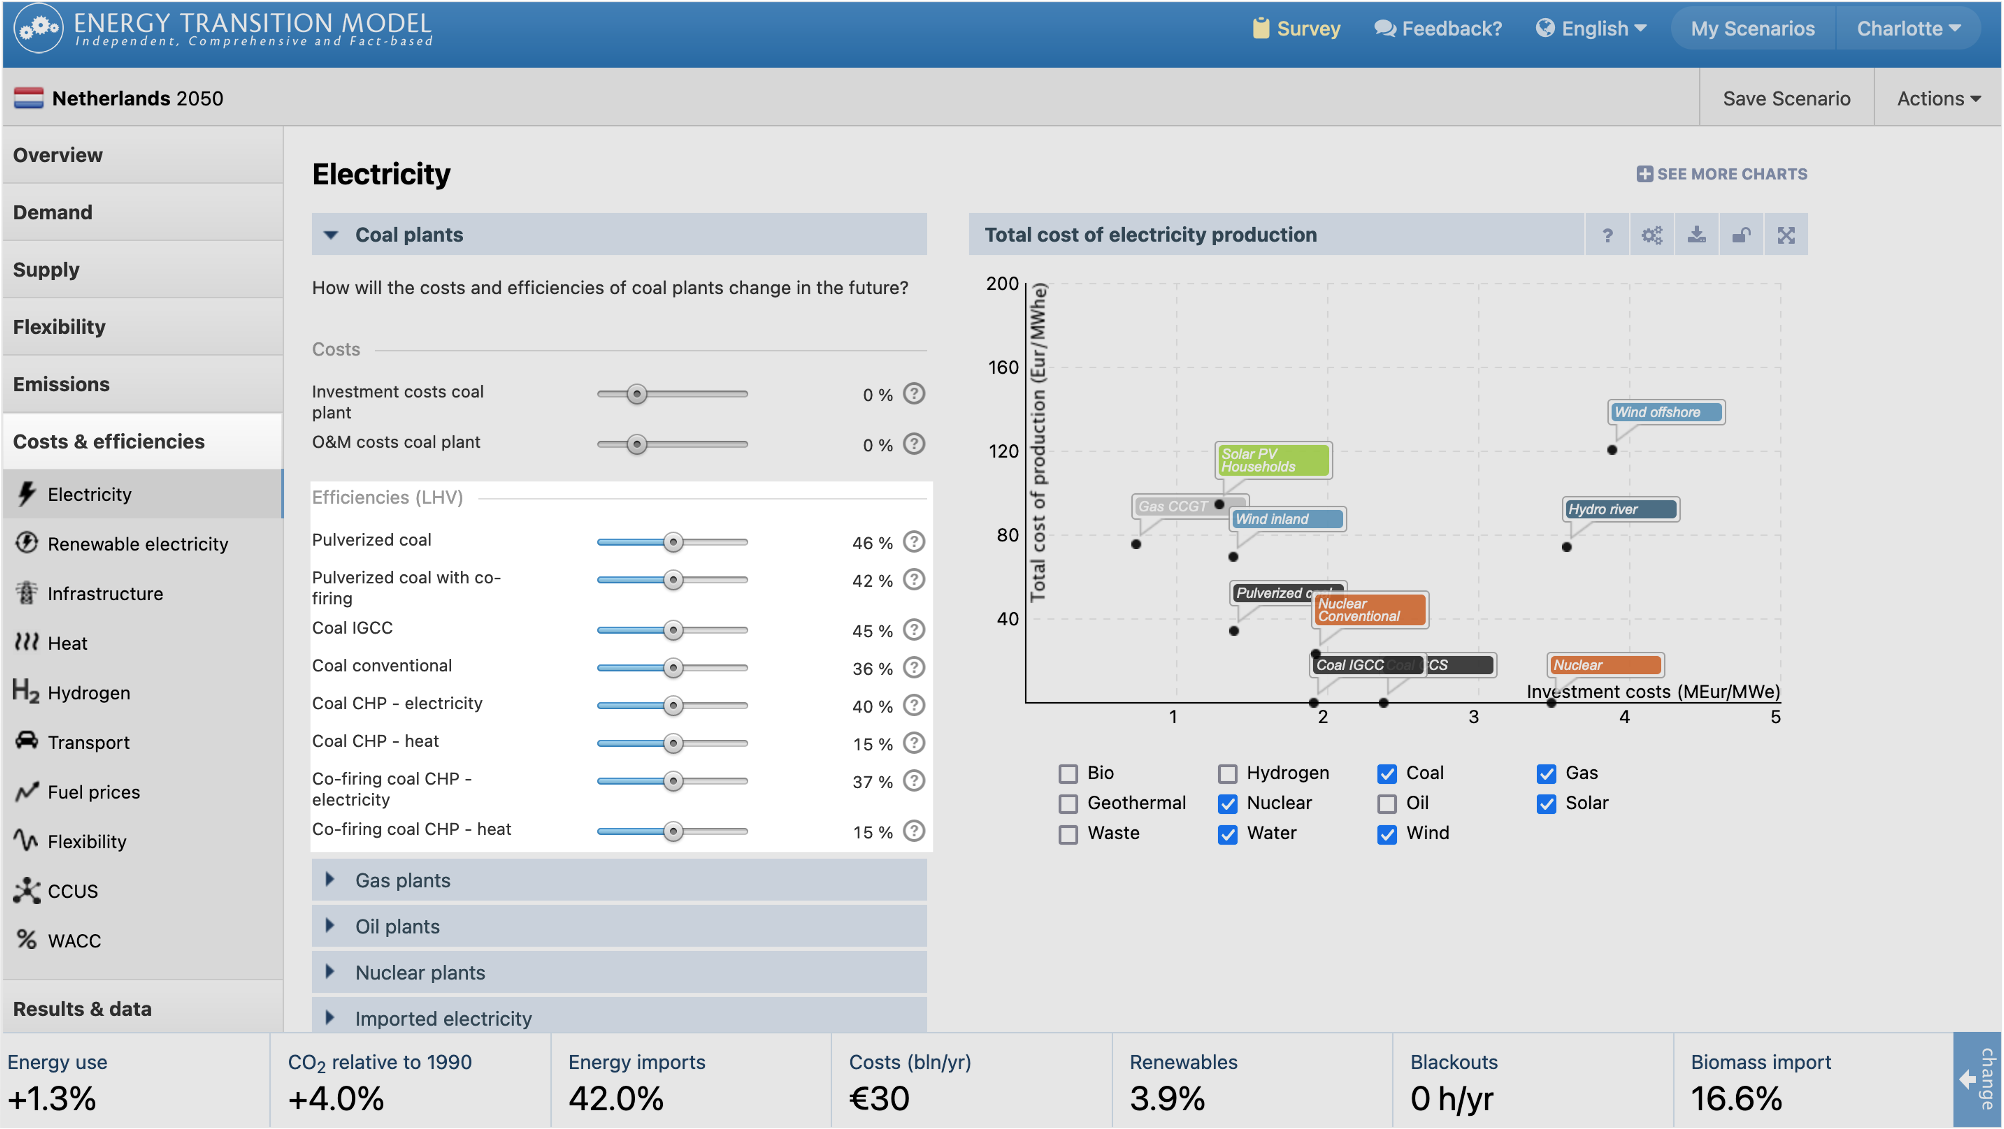
Costs section restructured and new efficiency sliders
The ‘Costs’ section in the ETM has been restructured and new sliders were added describing the efficiencies of technologies. This means you can now adjust the efficiencies of most technologies within the ETM. You can find the efficiency sliders under Electricity, Renewable electricity and Heat. The ‘Costs’ sidebar item has been renamed to ‘Costs & efficiencies’.
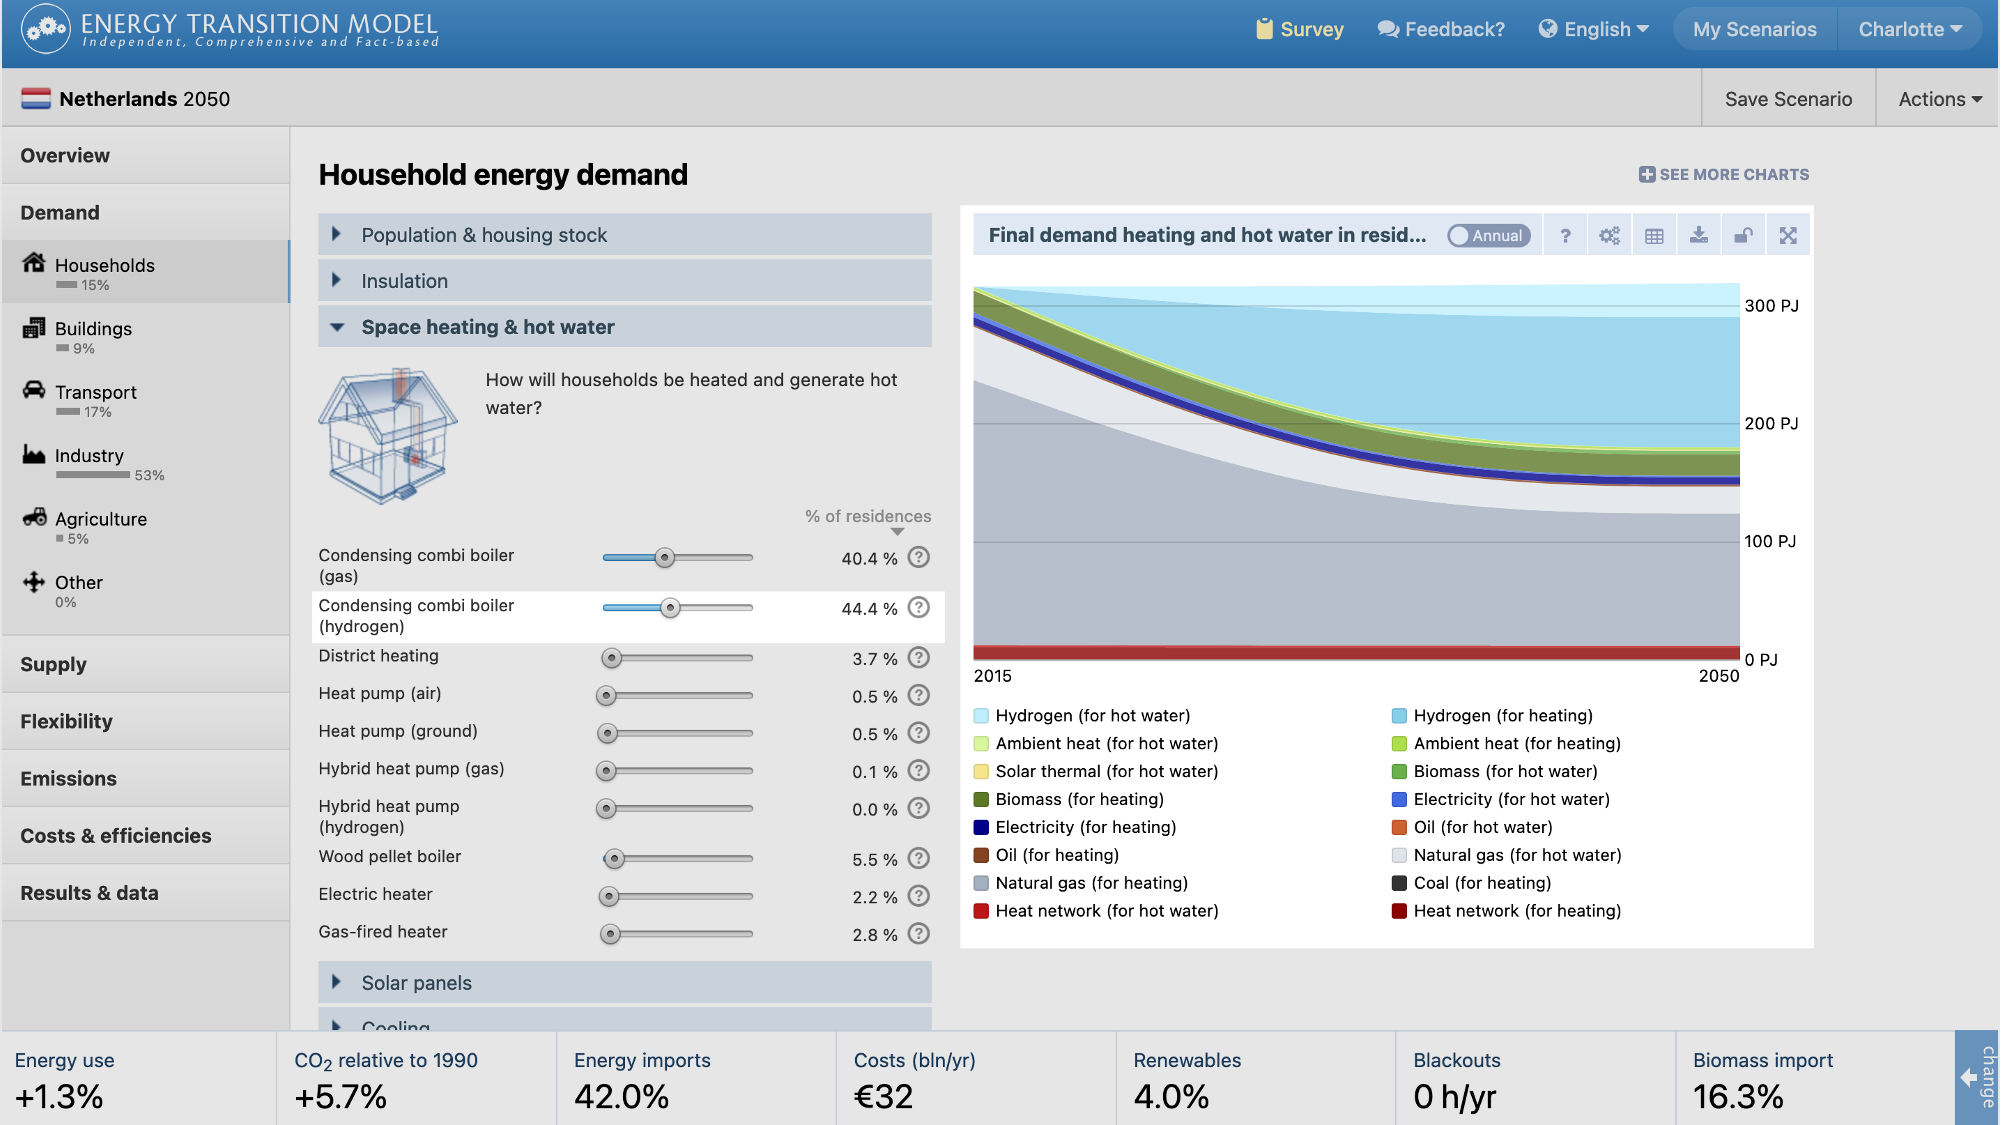
Condensing combi boiler (hydrogen) added for households and buildings
It is now possible to add condensing combi boilers on hydrogen for space heating and hot water to your scenario. Go to Demand → Households → Space heating & hot water to adjust the slider.
June 2021
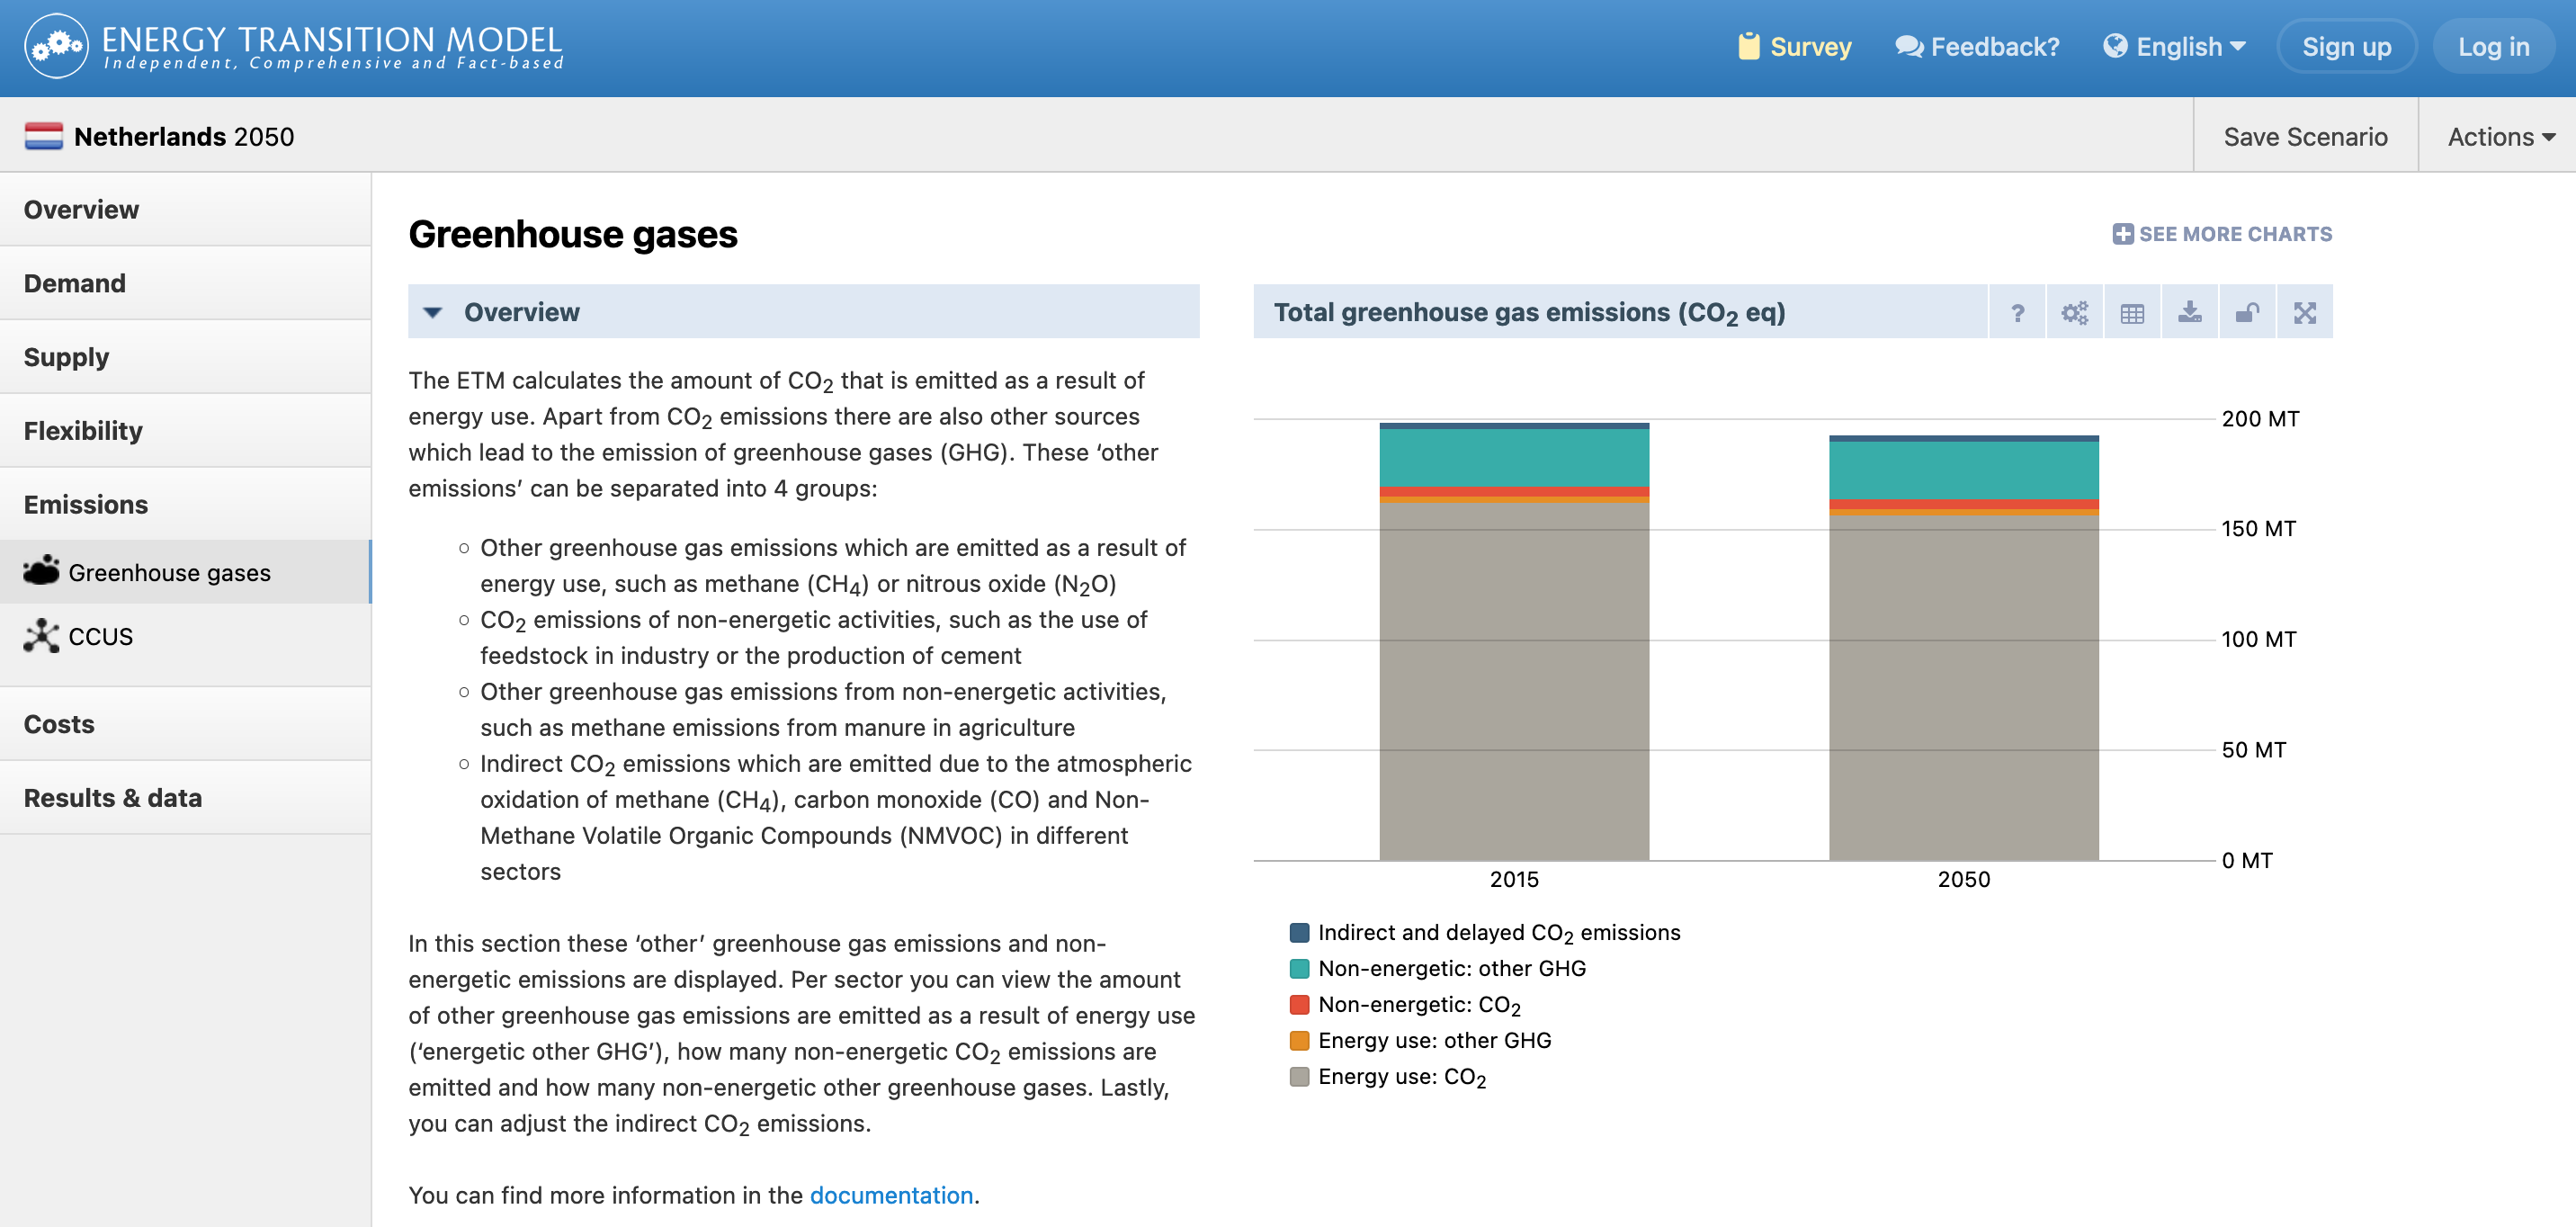
New Greenhouse gases section
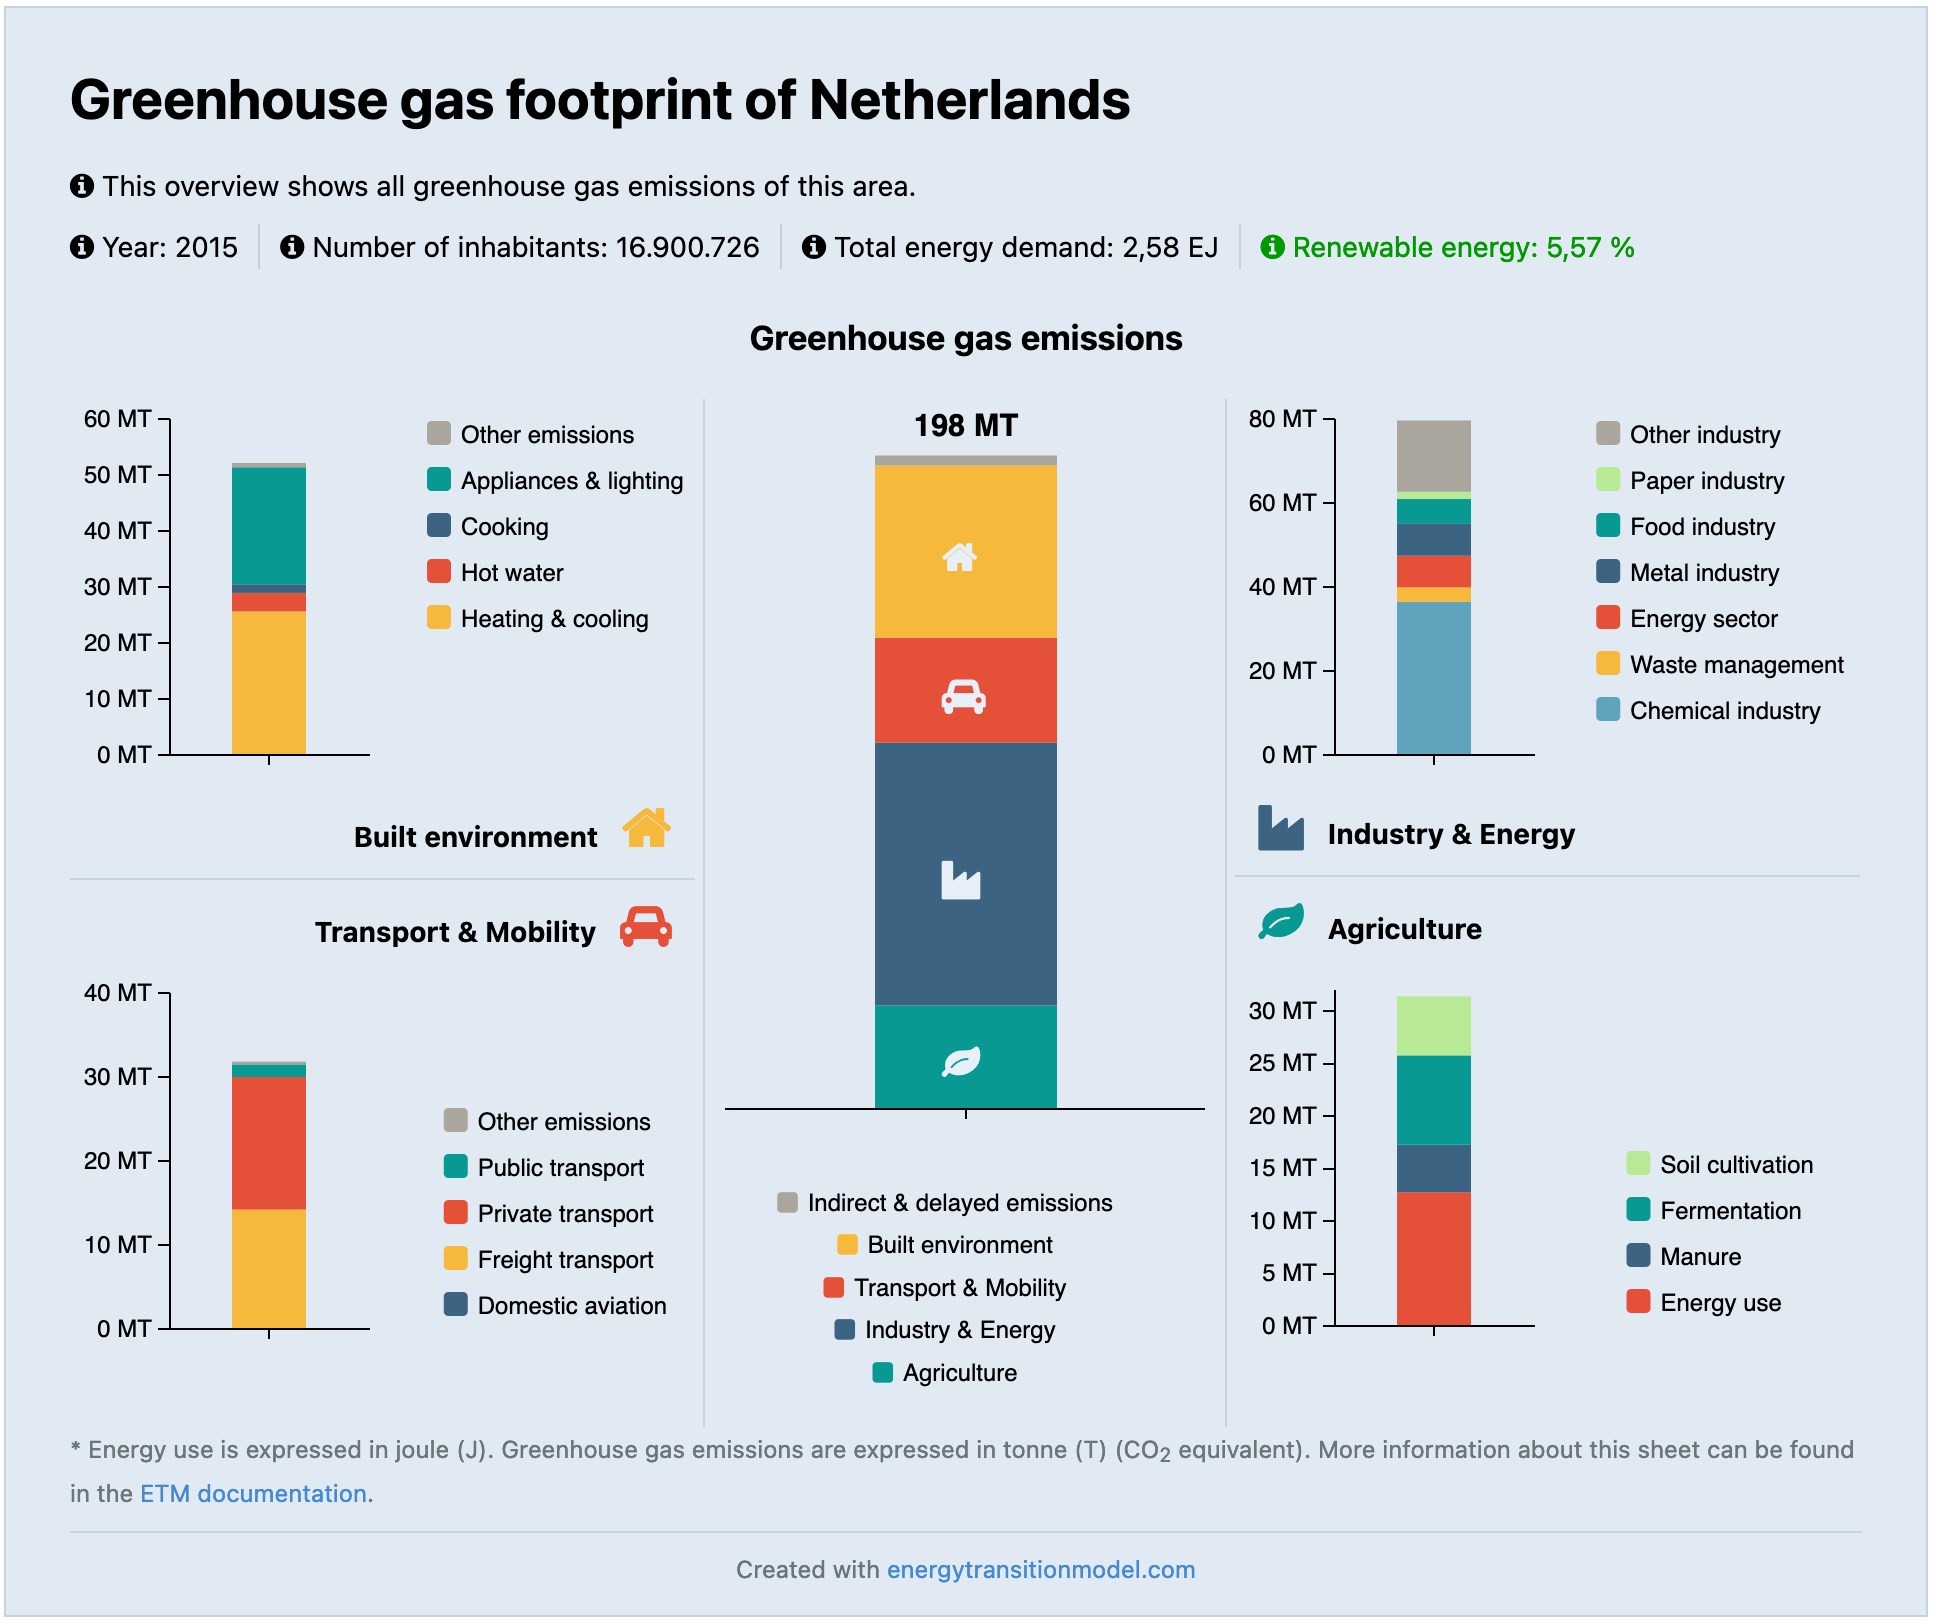
An Emissions item has been added to the sidebar consisting of the existing ‘CCUS’ section and a new ‘Greenhouse gases’ section. In the new Greenhouse gases section you can view and make assumptions about non-energetic CO2 emissions and other greenhouse gases. All energetic CO2emissions are automatically calculated in the ETM based on the energy system. By adding non-energetic CO2 emissions and other greenhouse gases to the ETM you can now get an overview of all emissions in your area. These emissions are now also included in the updated Greenhouse gas footprint.
Greenhouse gas footprint update
The emissions that were added to the new emissions section have also been added to the Greenhouse gas footprint. This means that the footprint now gives an overview of all emissions within your area.
May 2021
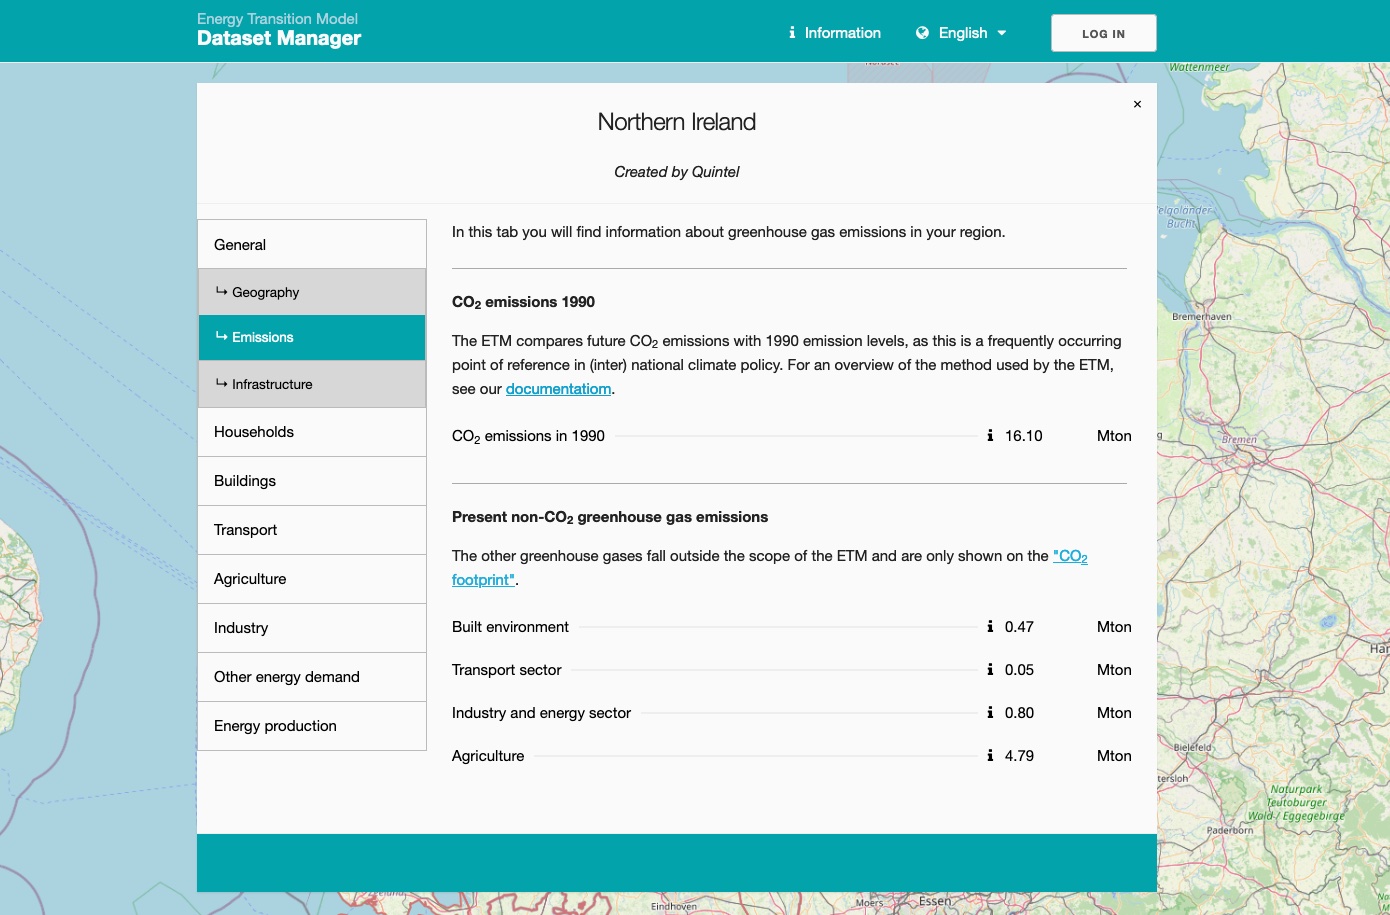
Regional source data available in ETM Dataset Manager
When you start a new scenario in the Energy Transition Model, source data for the present year is loaded into the model. This data represents the current state of the energy system of the region that you have selected. This present state is used as the basis for modelling your future scenario and is unique for every region.
To increase transparency, we have developed an online and version-controlled environment for the documentation of the regional source data: the ETM Dataset Manager. It gives a complete and structured overview of all data and sources used for the regions. At the moment, mostly regions within countries are included; in the long run all countries will also become available through the ETM Dataset Manager.
In the ETM we have added a button directing you to the selected region in the ETM Dataset Manager to view the source data, which may be found in Results & data → Source data.
April 2021
New chart showing the provision of flexibility
We have added a new chart showing the installed capacity of flexible supply and demand technologies; for example power-to-gas electrolysers or gas power plants. Comparing those capacities to the maximum shortage and excess peak can help you determine whether you have installed enough flexible capacity to balance your energy system.
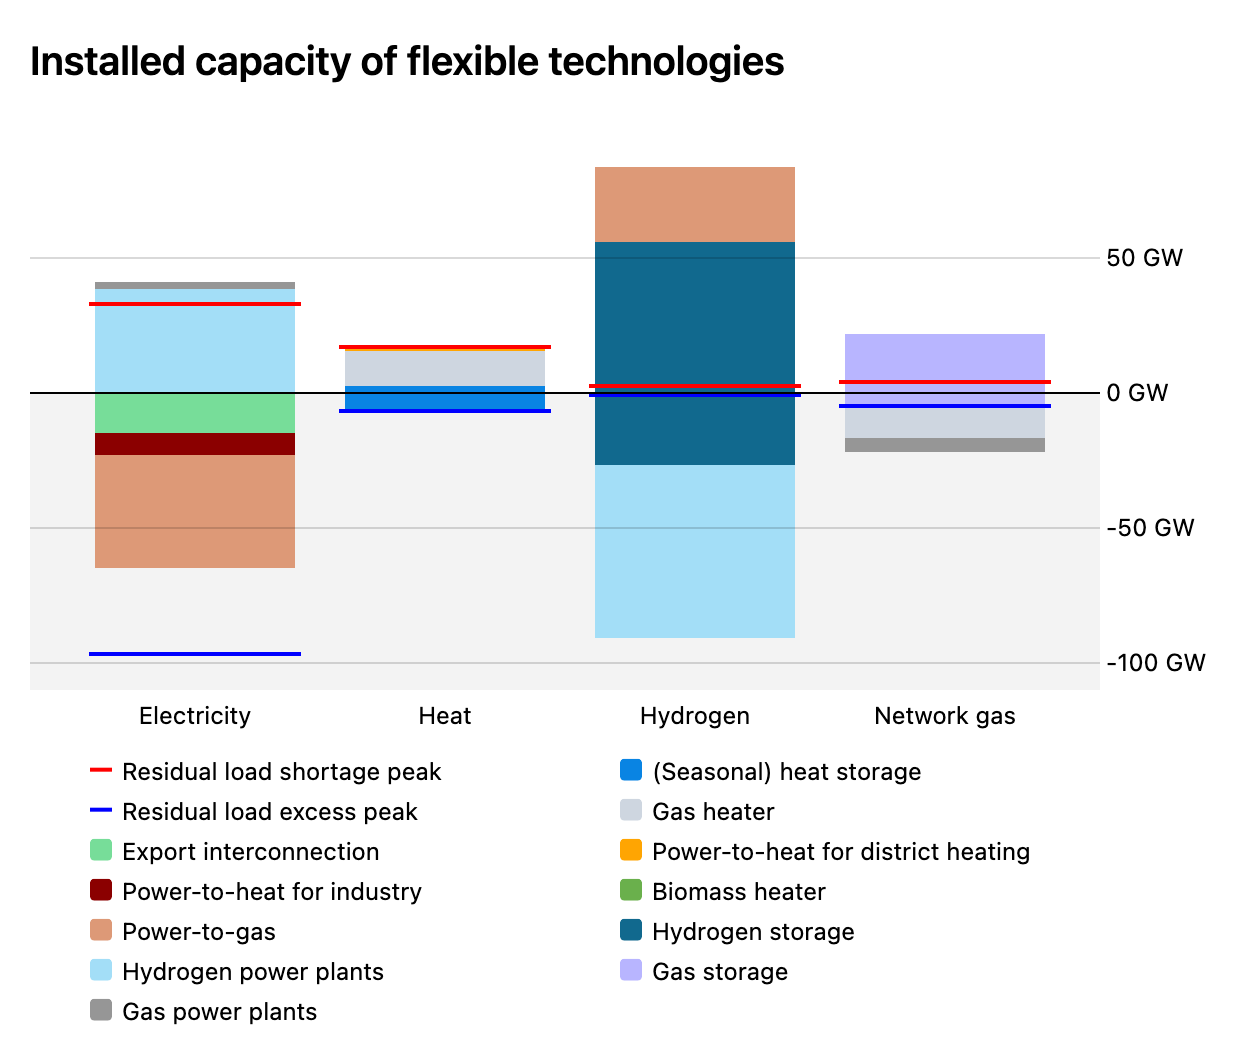
The chart can be found in Flexibility → Overview where we have also updated the explanations accompanying the other charts in this section. We now discuss the inflexible demand and supply and the residual load curves in more detail.
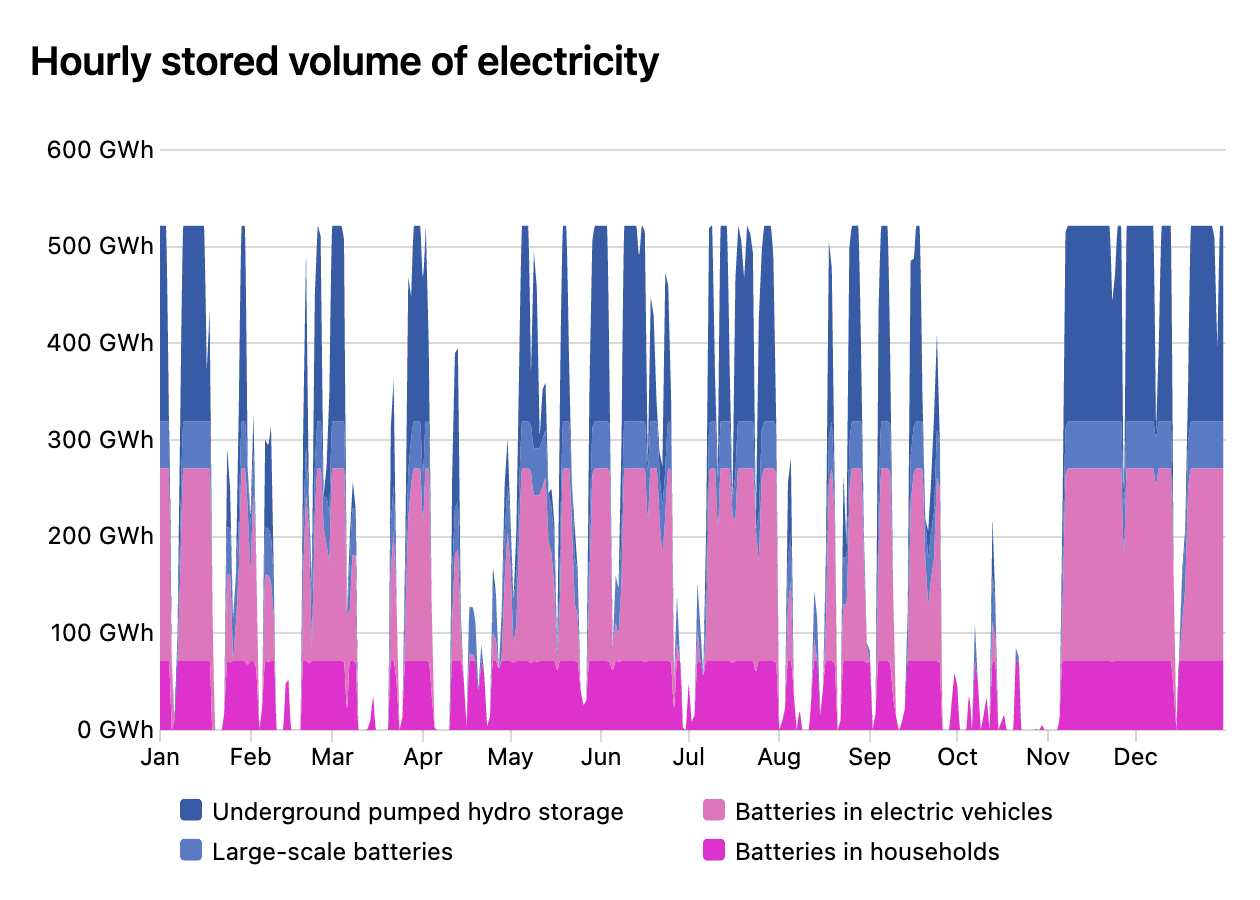
New chart showing the stored volume of electricity
A relevant performance metric for electricity storage technologies is the extent to which they are utilised. We have visualised the charging and discharging behaviour of these technologies in a new chart which shows the hourly stored volume of electricity.
You can find the chart in Flexibility → Excess electricity → Storage. You can choose to view all of the electricity storage technologies at once, or just one of…
- Batteries in households
- Batteries in electric vehicles
- Large-scale batteries
- Underground pumped hydro storage
- Reservoirs (depending on the selected region)
February 2021
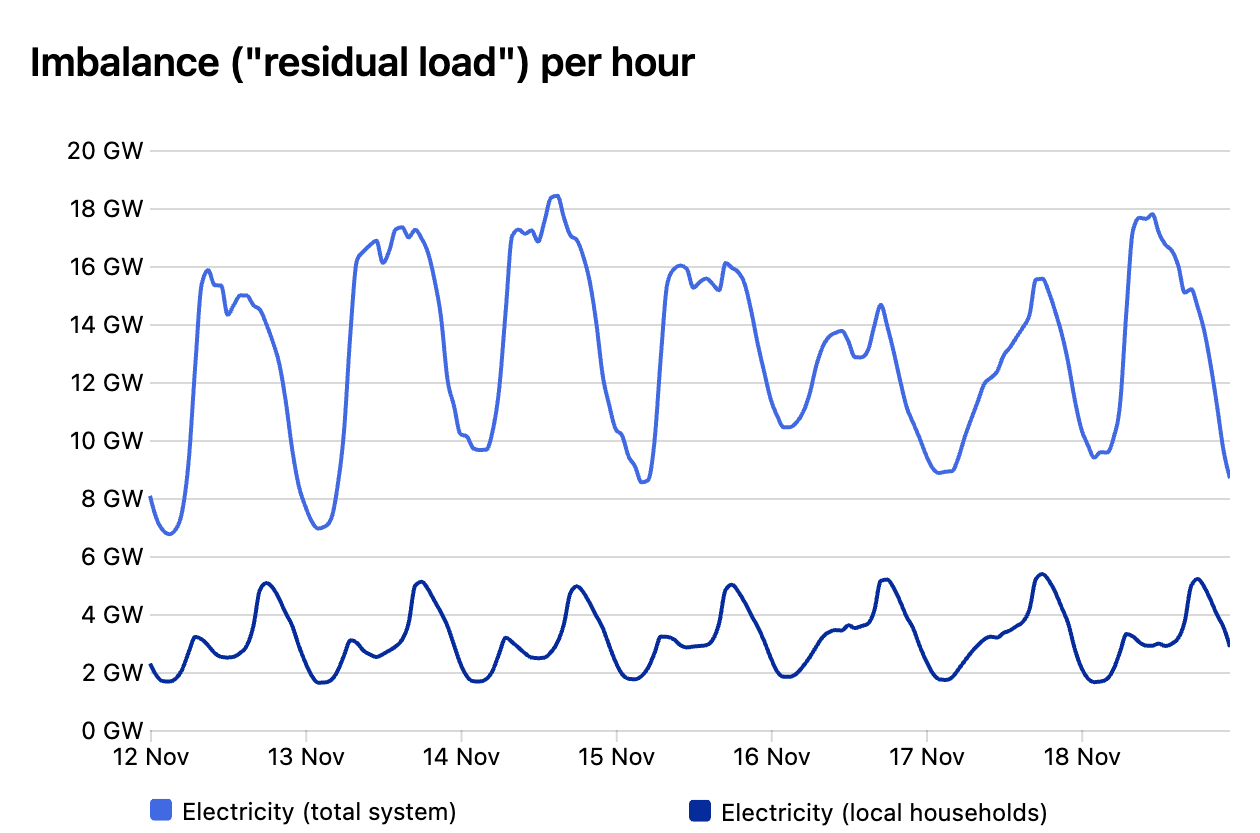
New charts showing the need for flexibility
Natural patterns like seasons (yearly), the variations in weather (weekly), day and night and our rhythm of waking up, going to work, coming home, etc. cause both the need for energy and the availability of energy to fluctuate. Flexibility is about balancing energy supply and demand on all these timescales.
We have added the section Flexibility → Overview to the ETM with four interactive charts in which you can see how supply and demand compare on various timescales. These charts show:
- Monthly supply and demand volumes
- Imbalance of monthly supply and demand volumes
- The need for flexibility: volume
- The need for flexibility: capacity
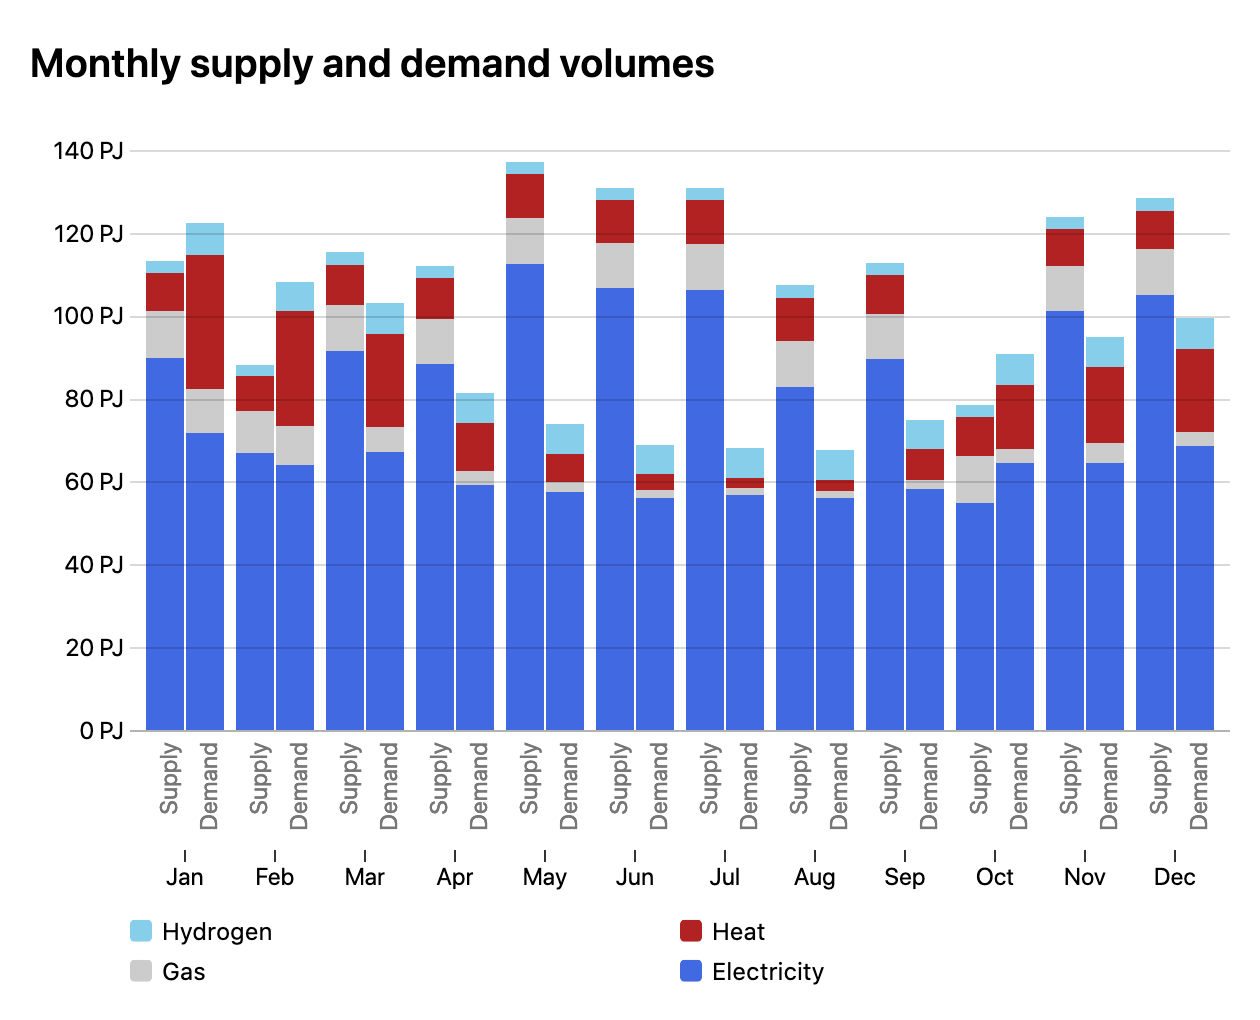
A detailed explanation can be found in the documentation.
Modify profiles
The ETM calculates the hourly production and demand of gas, electricity, heat, and hydrogen. It is now also possible to upload and work with your own curves in the Flexibility → Modify Profiles section. There are three types of profiles you can modify:
- Demand profiles (e.g. electric buses, industrial heating)
- Production profiles (e.g. solar PV, wind offshore)
- Price curves (e.g. for power interconnectors)
The chart on the right shows all profiles which you may customise. If you upload a custom profile this is directly reflected in the chart.
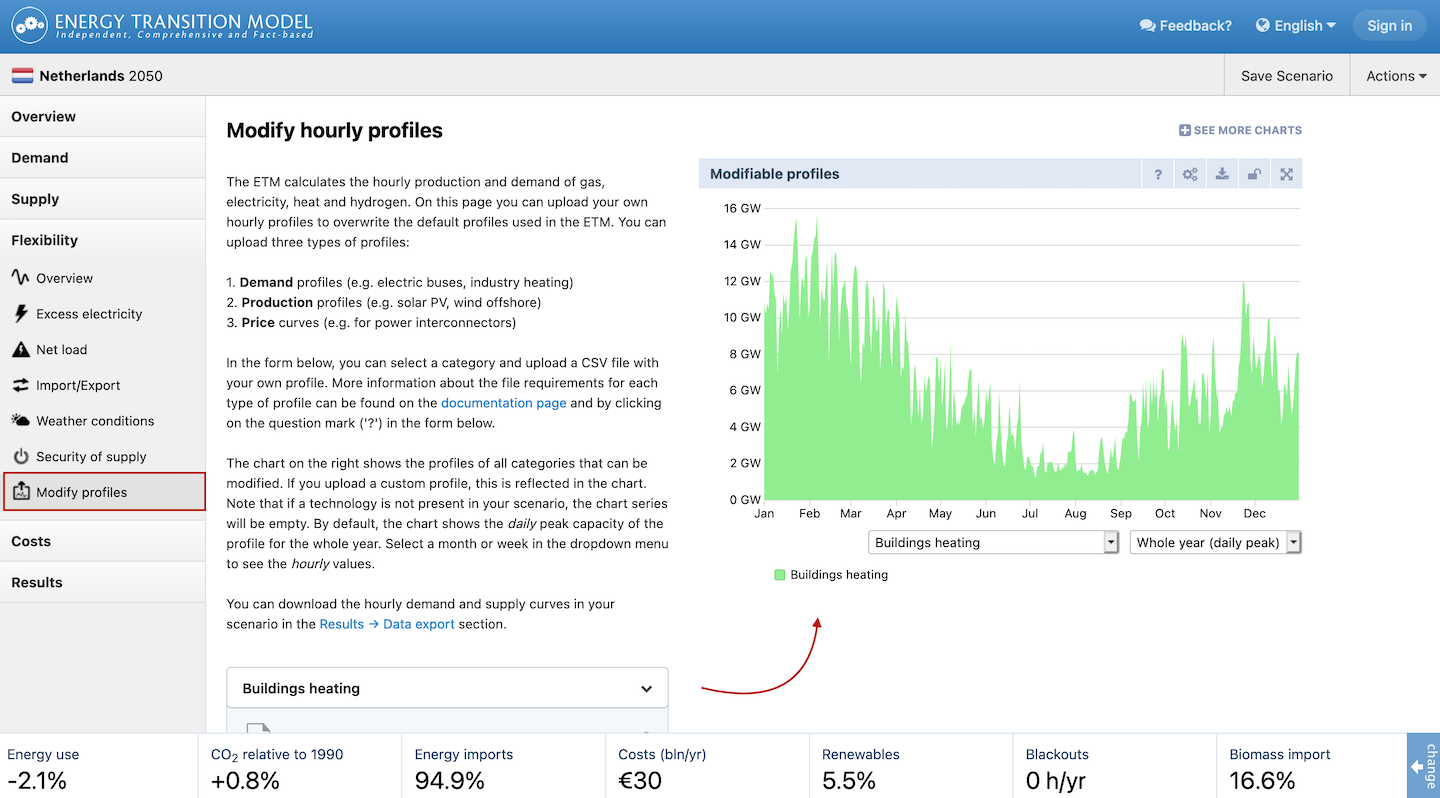
Check out the Curves documentation for more information.
Download charts as images
Need to use a chart in a report, or want to share it with colleagues? All charts in the model can now be downloaded as a high-resolution image by clicking the button just above the chart.

November 2020
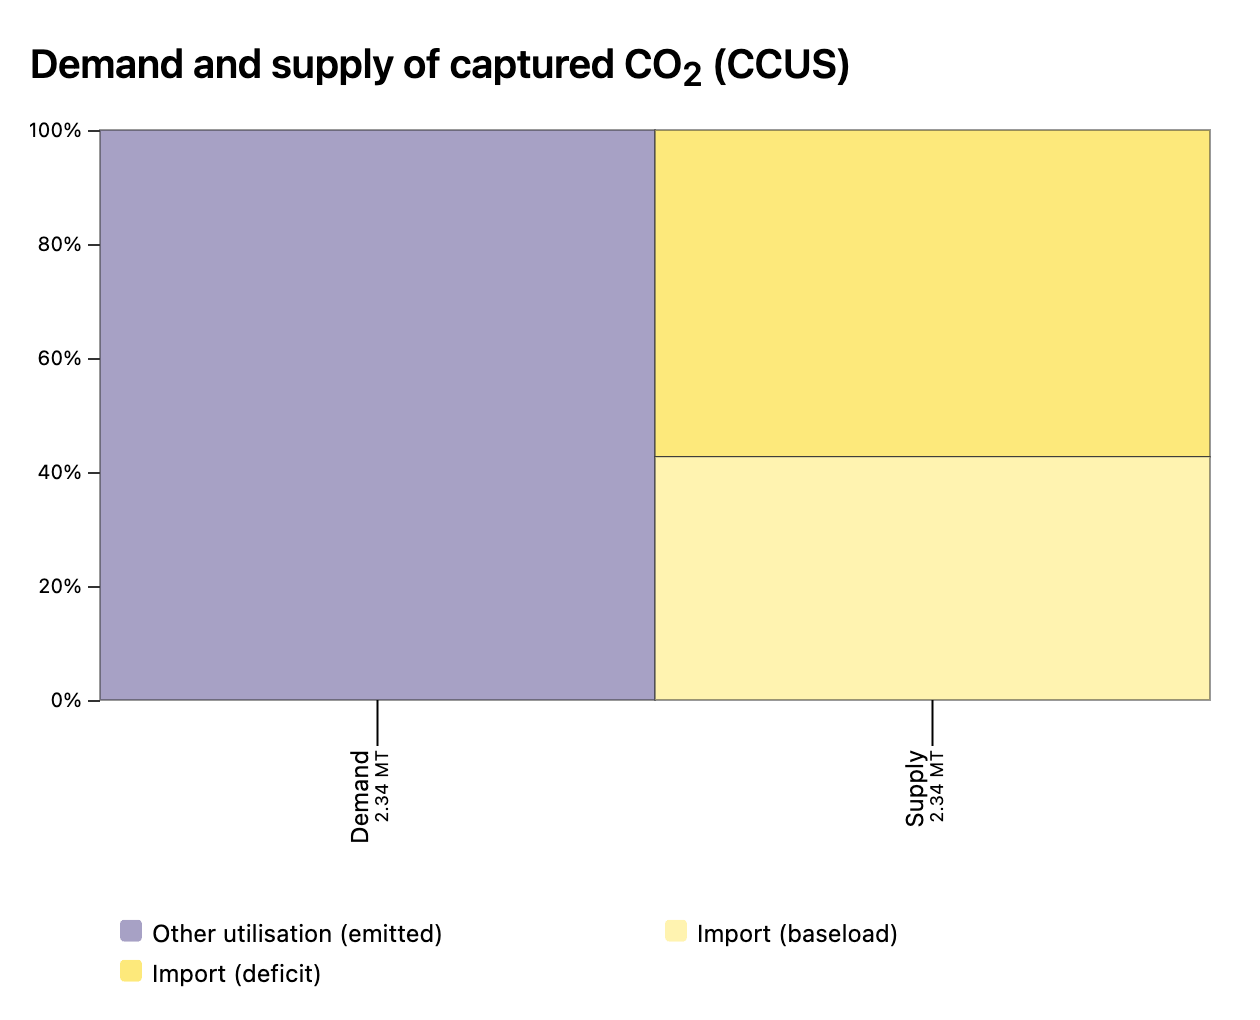
Carbon capture, utilisation and storage (CCUS)
Carbon capture, utilisation and storage (CCUS) is a group of emissions reduction technologies that can be applied across the energy system. The ETM now takes into account CCUS applications in much more detail than before.
The ETM models four types of carbon capture:
- Capture in industry. A distinction is now made between various sub sectors and production technologies and their respective capture potentials, costs and energy requirements.
- Capture in the power sector
- Capture for hydrogen production
- Direct Air Capture, a process of capturing CO2 directly from the ambient air using electricity.
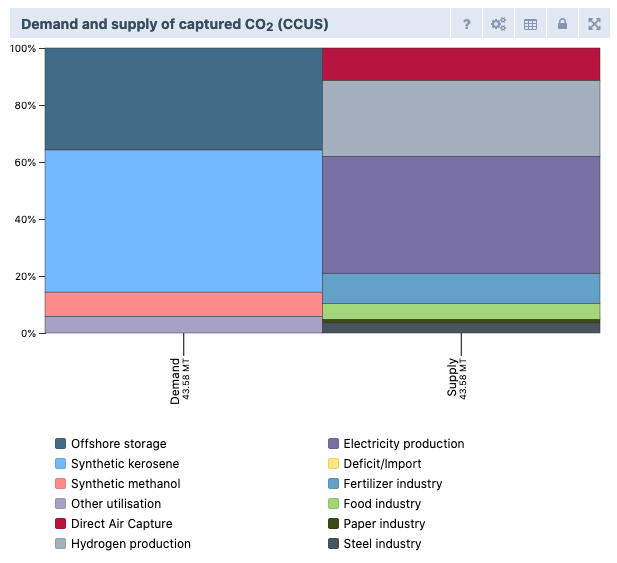
The ETM models four types of carbon usage:
- Offshore storage
- Utilisation of CO2 as feedstock for synthetic kerosene production
- Utilisation of CO2 as feedstock for synthetic methanol production
- Other utilisation, such as propellant gas for beer and soda or for the cultivation of crops in greenhouses.
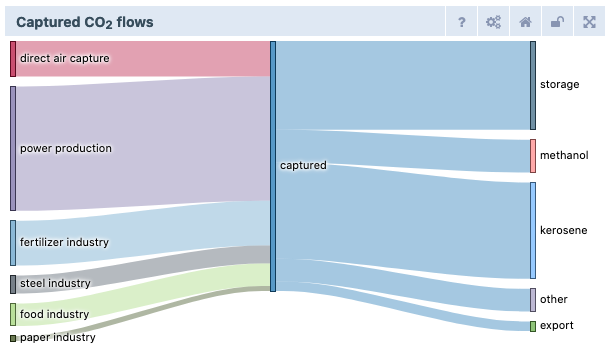
The ETM models two types of carbon transportation:
- Via pipelines
- Liquefied transport in ships
Discover these new features in the Supply → CCUS section! A detailed explanation can be found in our documentation.
Negative emissions
The ETM can now deal with so-called ‘negative’ CO2 emissions. Such emissions may arise when applying carbon capture to processes using biomass or when CO2 is captured directly from the ambient air using Direct Air Capture technology. See our documentation for more.
Scenario Navigation bar
A new scenario navigation bar has been added which shows the region and end year for your scenario; when you open one of your saved scenarios, the scenario name is also shown making it easier to have multiple scenarios open in different browser tabs. Quickly save your scenario with the “Save scenario” button on the right. It’s now easier to access all of your saved scenarios by visiting “My scenarios”.
Interaction possible with other models from the Mondaine Suite
Multiple energy models are used to explore different parts of the complex challenge of the energy transition. A collaboration between these models makes it possible to exploit the strengths of each individual model. In the context of the Mondaine project, the Energy System Description Language (ESDL) has been developed to support the communication between the different models - it allows the models to ‘speak’ the same language. ESDL can be used to describe information about spatial, technical, economical, social and temporal aspects of the energy transition, all in relation to each other. This makes it possible for a model to build further upon information from another model. The energy system defined in an ESDL file will be converted into slider settings - this makes it possible to explore the future energy system in the ETM and allows you to continue working on the scenario.
Check out the ESDL import functionality here!

June 2020
Multiple electrical interconnectors
Many countries import and export electricity with their neighbors through different interconnectors, and the ETM used to model this with a single electricity interconnector. However, in the real-world countries often have multiple interconnectors with different neighbours, each with their own capacity, price, and availability.
The ETM now models up to six independent interconnectors, each of which have configurable capacity, CO2 emissions, and price. You may choose whether to export only excess electricity, or if dispatchable plants may also produce electricity destined for export. You can realistically model all electricity flows across the borders of your country, and see an overview of all these electricity flows in a new chart.
Discover this new functionality in the Flexibility → Import/Export section!
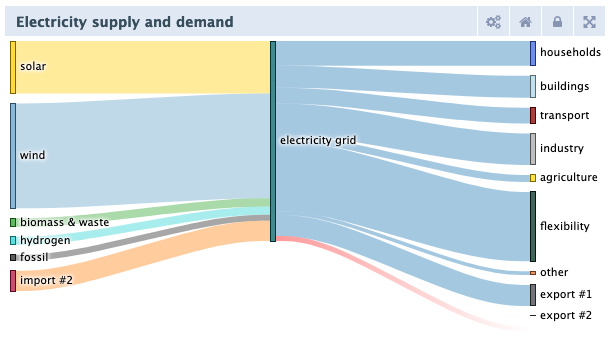
Heat demand curves for buildings and agriculture
The hourly heat demand curves in the buildings and agriculture sector are now temperature dependent. This means that the shape of the demand curves will change depending on the selected weather year. Previously, the ETM used static demand profiles for the buildings sector and a flat profile for agriculture. Both sectors now use the same profile, based on data from large gas consumers, which is generated dynamically using weather data. As a result, this profile is now also available for the weather years 1987, 1997, and 2004. Heat demand in buildings and agriculture responds to outdoor temperature fluctuations, just like households heating demand.
Get insight in the impact of the weather year selection on demand curves in the Flexibility → Weather conditions section!
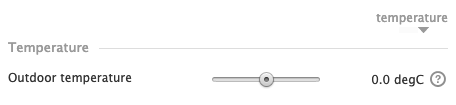
Impact of outdoor temperature on yearly energy demand
The impact of a higher or lower average outdoor temperature has been revised. In addition to heating and cooling demand in households and buildings, changing outdoor temperature now also affects heating demand in the agriculture sector. Heating demand in all three sectors now is more sensitive to temperature changes; the impact of temperature on heat demand is based on research by the Dutch gas TSO. See our documentation page for more info. This improvement is relevant for both the temperature slider and the weather year selection.
Check out this improvement in the Flexibility → Weather conditions section!
March 2020
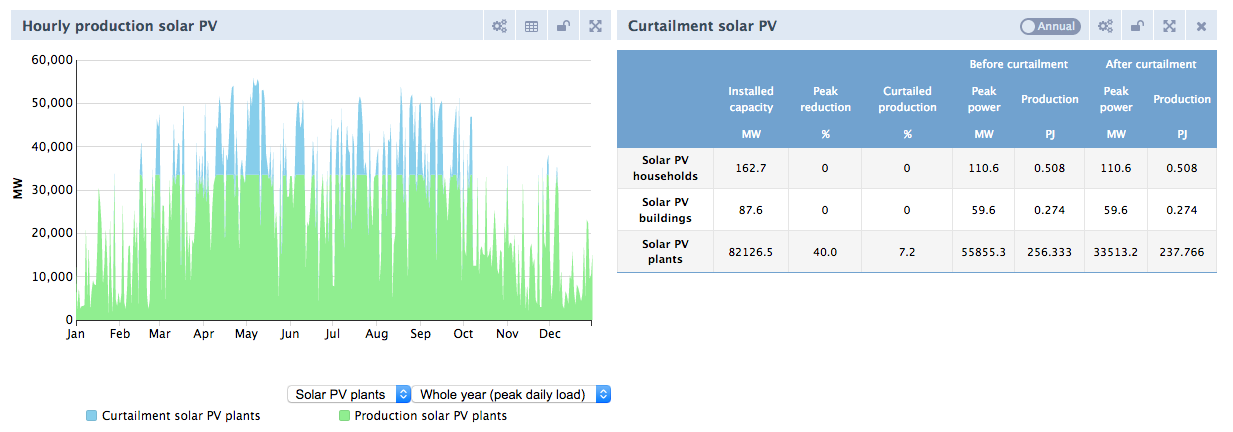
Curtailment of solar panels
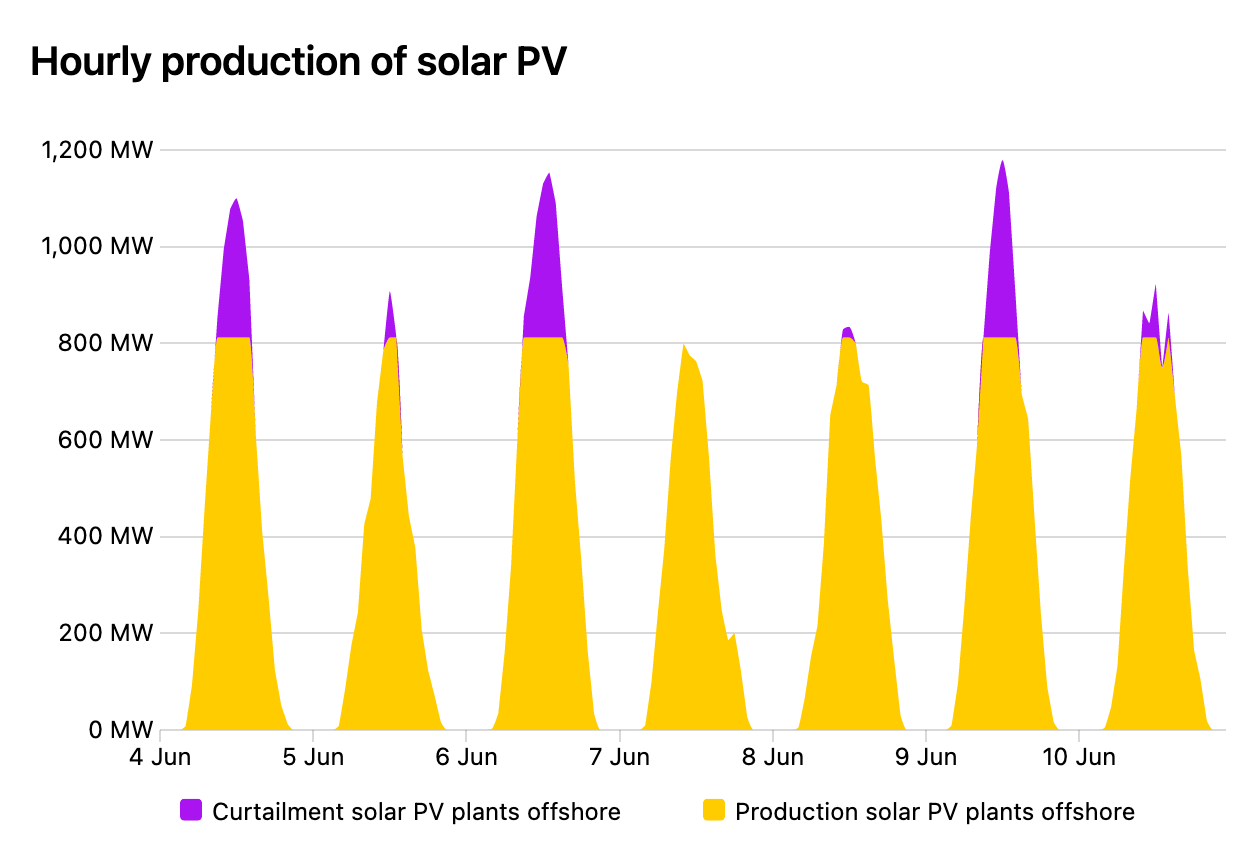
Installing a large capacity of solar PV panels may cause high peak demands on the electricity network. It is therefore desirable to be able to curtail these peaks. In some cases it might be smart to connect solar parks to a certain percentage of its peak power. It is now possible to set the curtailment as a percentage of the peak power in the ETM.
Discover the curtailment of solar panels in the Flexibility → Net load section!
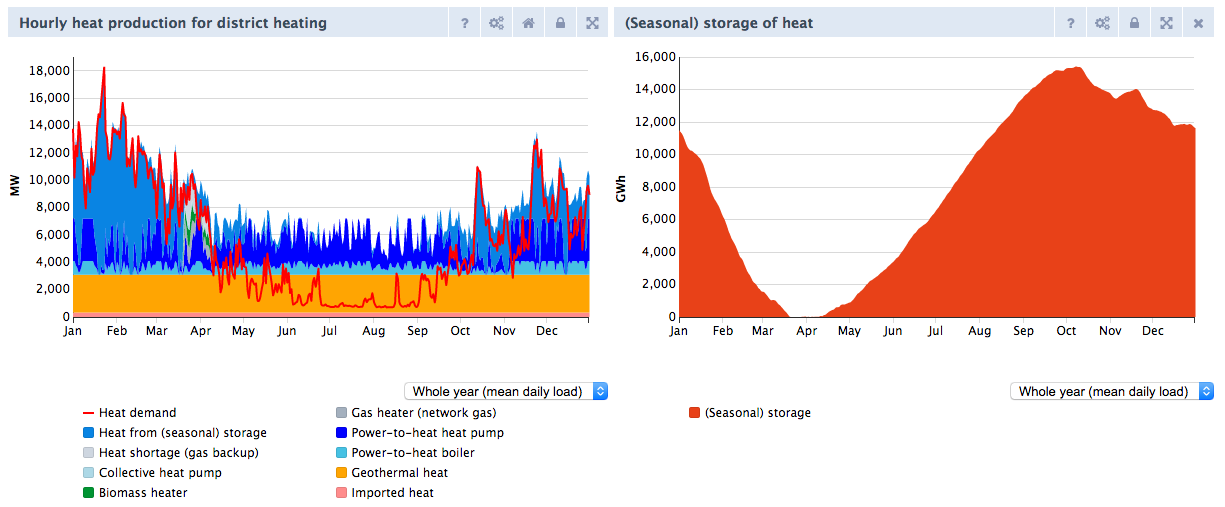
Convert excess electricity into heat for district heating
It is now possible to convert electricity excesses from solar and wind production into heat for district heating. This can be done by means of a power-to-heat (P2H) electric boiler and a P2H heat pump that only produce heat when there is an excess of electricity. The produced heat can be used immediately or can be stored for later use. For example, it is now possible to use solar and wind electricity excesses to heat households during winter.
Check out the P2H sliders for district heating in the Flexibility → Excess electricity → Conversion section!
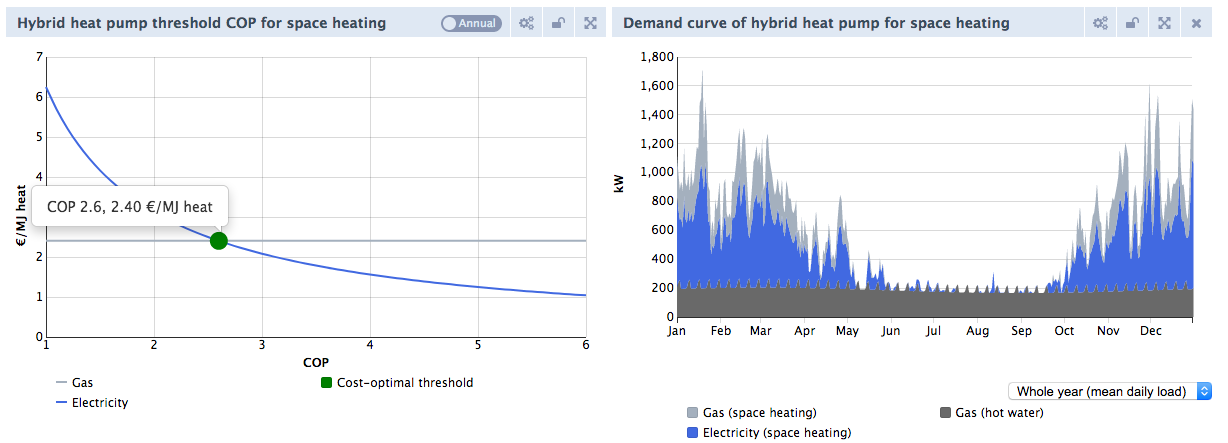
Get insight in behaviour of hybrid heat pumps
The efficiency of hybrid heat pumps (HHP) is dependent on the ambient temperature and is depicted by the coefficient of performance (COP). The COP becomes lower as the outside temperature decreases. In the ETM you can set the COP threshold above which the HHP switches from gas to electricity. You can choose a setting that is most financially attractive for the consumer, but you can also choose a setting that produces less impact on the electricity network. Two charts have been added to assist the user in making this choice: a chart showing the cost-optimal threshold COP based on the consumer gas/electricity price and a chart showing gas and electricity demand per hour.
Get insight in hybrid heat pump behavior in the Flexibility → Net load section!
Improved heating demand curves for households
The improved hourly heating demand curves used in the ETM better account for the concurrency of heating demand. The new curves are based on the average demand of 300 houses. Previously, demand curves were based on individual households which led to an overestimation of demand peaks.
Note: Because the heat demand peaks for households are lower, the results of your scenario might change. For example, when many houses are connected to district heating fewer back-up boilers may be required. If many houses have a heat pump installed, the peak load on the electricity grid will be reduced. If you are having trouble understanding the differences, don’t hesitate to email us.
Data export adjusted
In the data export, the hourly electricity curves for space heating in households have been broken down into series for individual heating technologies. This makes it possible to view the electricity hourly demand curve for air source heat pumps and other electric heating technologies.
January | February 2020
District heating improved and expanded
The modeling of district heating has been improved and expanded!
Heating networks in households, buildings, and agriculture have been merged into one network (“residential district heating”). It is no longer possible to exchange excess heat between industrial (steam) networks and residential networks.
The demand and production of heat for residential district heating is now calculated on a hourly basis instead of on an annual basis.
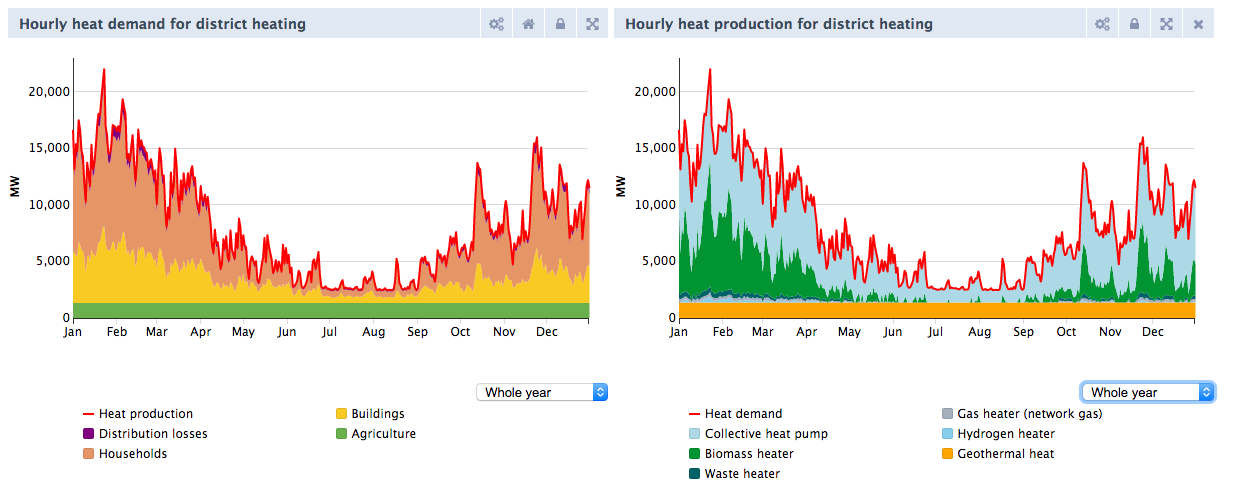
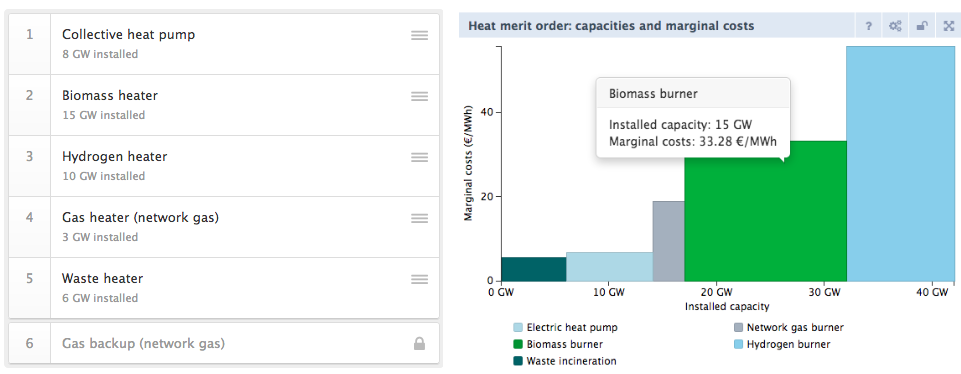
A distinction is made between “must-run” sources and “dispatchable” sources. Dispatchables only run if the must-runs do not produce enough to meet the demand. Their operating hours and profiles are therefore variable. Users can set which heaters start first
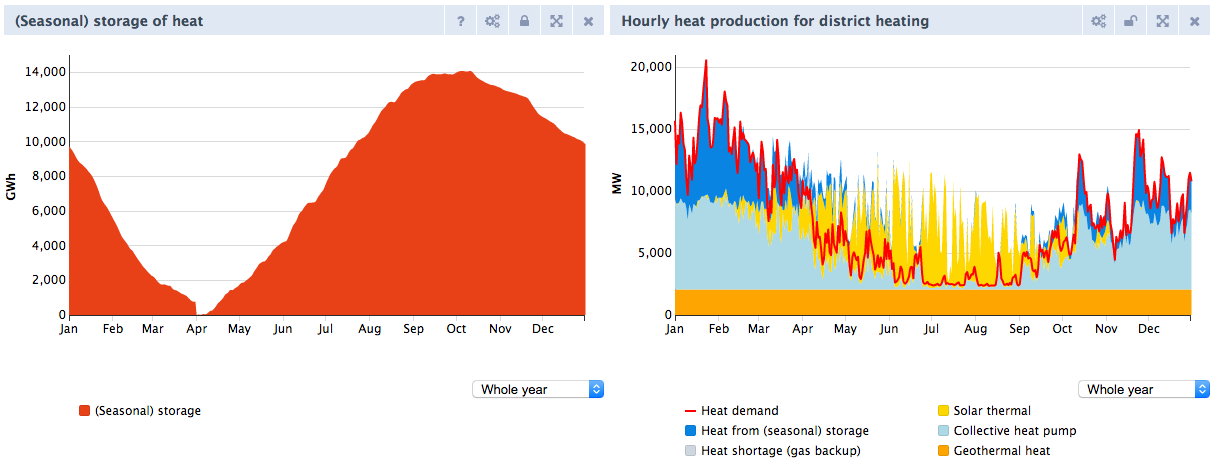
It is now possible to use large-scale solar thermal plants for residential district heating
Users can choose to turn seasonal heat storage ‘on’. In that case, overproduction of must-run sources is stored for later use instead of being dumped
Residual heat from the fertilizer, chemical, refining, and IT sectors can be used and fed into residential district heating networks. View our documentation on GitHub for the method and sources used
The cost calculation for heat infrastructure has been improved. Instead of calculating a fixed amount per connection, the costs are now subdivided into indoor costs, distribution costs (pipelines, substations) and primary network costs. The cost calculation has been aligned with the Vesta MAIS model, making comparisons and exchange of outcomes between the ETM and Vesta MAIS easier. View our documentation on GitHub for more information.
Discover the improved modelling of district heating in the District heating → Heat sources section and check out our Github documentation for a more detailed explanation.
CHPs modeled differently
All CHPs (with the exception of biogas-CHP) now also work as dispatchable in the electricity merit order, including the industrial CHPs. CHPs are therefore now running primarily for the electricity market. Their heat production is therefore a “given” (must-run) for heat networks. Previously, CHPs were uncontrollable and ran with a fixed, flat production profile. This change may have an impact on your scenario outcomes!
Wind load curves improved
The wind load curves for the default dataset of the Netherlands are now created using the same (KNMI-based) method as used for the extreme weather years (1987, 1997, 2004). This ensures more consistency between the different datasets for the Netherlands. Check out our Github documentation for a more detailed explanation of this method.
Documentation more accessible
For certain sliders it was already possible to view the technical specifications so that you could see our assumptions. Now we go one step further and for many sliders we also make our entire background analysis available (which is already on GitHub) at the touch of a button. From the technical specifications table you can download this analysis directly as an Excel file.
Download slider settings
For saved scenarios it is possible to download the values of your sliders as a CSV file. This can be useful if you want to list all your scenario changes. View your saved scenarios via “User> My scenarios” (top right in the ETM) and click on the title of the desired scenario. Now enter ‘.csv’ after the url (so you get pro.energytransitionmodel.com/saved_scenarios/0000.csv) and the download starts immediately.
Data export adjusted
The format of the load and price curves of electricity has recently changed. For each column in the data export the extension “input” or “output” is used to indicate whether the data represents demand or supply of electricity. Flexibility solutions have two columns now, both for the electricity input and output. With these changes, the format of the data exports of electricity, network gas and hydrogen are more consistent.
You can find the adjusted data export here in the Data export → Merit order price section.